The Apteco Datathon: 3. how can you win an Olympic medal?
20 Sep 2018 | by Tom Taylor
In the third of our Apteco Datathon series we continue to deep dive into real-life datasets to analyse and interpret the numbers. In this blog we examine what it takes to be an Olympic athlete – and your best chances of winning a medal.
In our last blog we explored a dataset containing international football matches starting from 1872. Continuing this sporting theme, we created and explored a FastStats system containing 120 years of Olympic data. What can we learn from this data and could it show us how to improve our chances of standing on the podium with an Olympic medal around our neck?
The Dataset
Conveniently for us, a dataset scraped from sports-reference.com was put into a nice csv format and hosted on kaggle. We combined this with a US government dataset containing various measurements of country development. With a bit of tweaking this gave us two tables: Athletes; and Events. The data for each table is:
- Athletes
- ID
- Height
- Weight
- Sex
- Name
- Events
- Athlete
- Athlete age at the event
- Competing country and NOC code (National Olympic Committee Code e.g. GBR)
- Team (e.g. Denmark/Sweden or USA)
- Host city
- Sport and event
- Medal
- Event year
To attach the country data to the relevant country in the events table, the NOC code was used with a lookup table to its associated country. This isn’t always appropriate as there are occasionally mixed nation teams representing under the same country code, but this rarely happens. Plus more often than not the team countries are very similar in terms of development (note the Denmark/Sweden example). This gives us a total of 135,571 athletes, with 271,116 unique entries, and information for 205 countries.
As there’s no data for the 2018 winter Olympics in PyeongChang, we’ll only be looking at the summer games.
Diving into the data
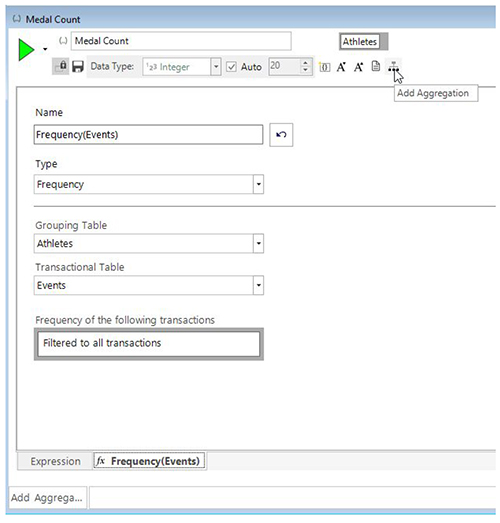
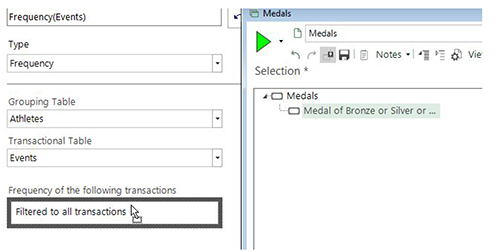
To first verify the integrity of the data, let's look at something we already know. How about identifying the most decorated Olympic athlete? We'll begin this by making an aggregation of events that have a bronze, silver or gold medal.
Using this value on a selection by applying it for the top n results gives us the data grid:
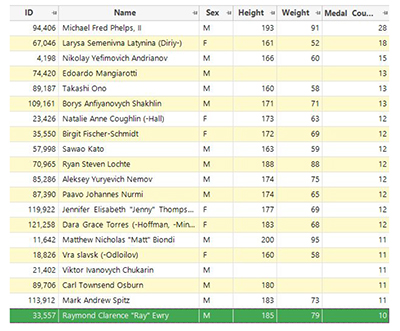
with Michael Phelps on top. That's reassuring.
How the games have changed
Evidently the games are a totally different beast from 120 years ago, but how have they changed? Let’s start by looking at event entries over time on a chart.
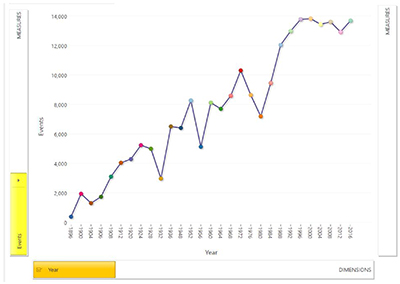
From this we can see some dips in 1932, 1956, 1976, and 1980. The 1932 games was hosted in Los Angeles, and as a result many competitors couldn’t afford to pay for the trip there. In 1956, these countries didn’t compete for the following reasons:
- Egypt, Iraq, and Lebanon in response to the Suez Crisis.
- Netherlands, Cambodia, Spain, and Switzerland in response to USSR crushing the Hungarian Revolution.
- People's Republic of China as a result of Republic of China (Taiwan) being allowed to compete
In 1976, 29 countries boycotted the games due to the IOC not banning New Zealand for the All Blacks tour of South Africa.
In 1980, 65 countries boycotted the games in Moscow in protest of the 1979 Soviet-Afghan war.
Let’s now have a look at the breakdown of events to see how the popularity of sports has changed.
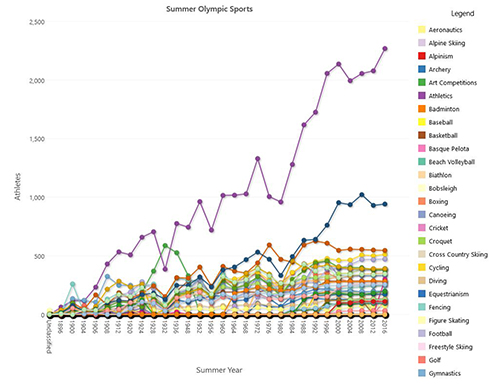
In the modern Olympics there’s not been much variation, with athletics in purple being the most popular sport in terms of entries, followed by swimming in blue, and rowing in orange.
However, in 1932 we can see one green spike in popularity for an odd sport… Art competitions! This division of the Olympic Games was hosted from 1912 until 1948 but stopped due to “concerns about amateurism and professionalism”. The IOC also doesn’t recognise the medals awarded as official anymore, but this doesn’t make it any less interesting.
Something more personal
As I was looking into this dataset I realised I had a massive desire to win an Olympic medal. Luckily, with all this data in front of me I had an advantage over all those fools who blindly choose a sport to compete in for fun – I could statistically look at the data to define the sport in which achieving a medal is most probable.
I looked at the summer games since 2000, and using BMI and age created a cube with the mode event type as a statistic. Here's what comes out of this for men:
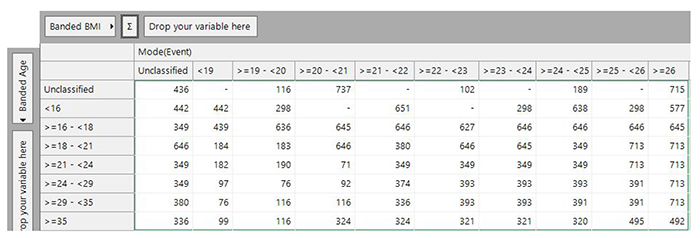
If you hover the mouse over a cube entry a popup will show with the relevant event. For example, I weigh 65kg and stand 1.8m tall, so my BMI is 65 / 1.8 ^ 2 = 20.1, and my age is 22. This puts me on event ID 71, which is Athletics Men’s 1,500 meters. Maybe it’s time to start doing a few laps of the track.
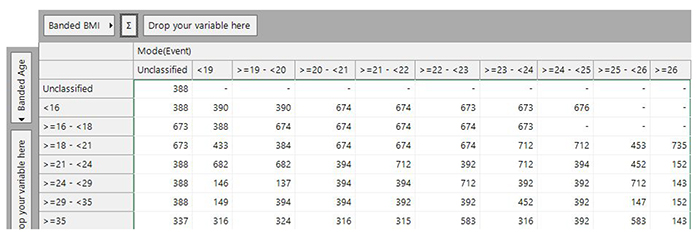
Below is the same table for women and an index lookup table so you're able to see what would suit you best too.
|
Event ID |
Title |
|
71 |
Athletics Men's 1,500 metres |
|
76 |
Athletics Men's 10,000 metres |
|
92 |
Athletics Men's 4 x 400 metres Relay |
|
97 |
Athletics Men's 5,000 metres |
|
99 |
Athletics Men's 50 kilometres Walk |
|
102 |
Athletics Men's 800 metres |
|
116 |
Athletics Men's Marathon |
|
143 |
Athletics Women's Discus Throw |
|
146 |
Athletics Women's High Jump |
|
147 |
Athletics Women's Javelin Throw |
|
149 |
Athletics Women's Marathon |
|
152 |
Athletics Women's Shot Put |
|
183 |
Boxing Men's Featherweight |
|
184 |
Boxing Men's Flyweight |
|
189 |
Boxing Men's Light-Welterweight |
|
298 |
Diving Men's Platform |
|
315 |
Equestrianism Mixed Dressage, Individual |
|
316 |
Equestrianism Mixed Dressage, Team |
|
320 |
Equestrianism Mixed Jumping, Individual |
|
321 |
Equestrianism Mixed Jumping, Team |
|
324 |
Equestrianism Mixed Three-Day Event, Team |
|
324 |
Equestrianism Mixed Three-Day Event, Team |
|
336 |
Fencing Men's epee, Team |
|
337 |
Fencing Women's Foil, Individual |
|
349 |
Football Men's Football |
|
374 |
Gymnastics Men's Parallel Bars |
|
380 |
Gymnastics Men's Team All-Around |
|
384 |
Gymnastics Women's Balance Beam |
|
388 |
Gymnastics Women's Team All-Around |
|
390 |
Gymnastics Women's Uneven Bars |
|
391 |
Handball Men's Handball |
|
392 |
Handball Women's Handball |
|
393 |
Hockey Men's Hockey |
|
394 |
Hockey Women's Hockey |
|
398 |
Judo Men's Extra-Lightweight |
|
433 |
Rhythmic Gymnastics Women's Group |
|
436 |
Rowing Men's 17-Man Naval Rowing Boats |
|
439 |
Rowing Men's Coxed Fours |
|
442 |
Rowing Men's Coxed Pairs |
|
452 |
Rowing Women's Coxed Eights |
|
453 |
Rowing Women's Coxed Fours |
|
492 |
Sailing Mixed Three Person Keelboat |
|
495 |
Sailing Mixed Two Person Keelboat |
|
577 |
Shooting Mixed Trap |
|
583 |
Shooting Women's Sporting Pistol, 25 metres |
|
627 |
Swimming Men's 1,500 metres Freestyle |
|
636 |
Swimming Men's 200 metres Backstroke |
|
638 |
Swimming Men's 200 metres Butterfly |
|
645 |
Swimming Men's 4 x 100 metres Medley Relay |
|
646 |
Swimming Men's 4 x 200 metres Freestyle Relay |
|
651 |
Swimming Men's 400 metres Freestyle |
|
673 |
Swimming Women's 4 x 100 metres Freestyle Relay |
|
674 |
Swimming Women's 4 x 100 metres Medley Relay |
|
676 |
Swimming Women's 400 metres Freestyle |
|
682 |
Synchronized Swimming Women's Team |
|
712 |
Volleyball Women's Volleyball |
|
713 |
Water Polo Men's Water Polo |
|
715 |
Weightlifting Men's All-Around Dumbbell Contest |
|
735 |
Weightlifting Women's Super-Heavyweight |
|
737 |
Wrestling Men's Bantamweight, Freestyle |
While this is quite a fun piece of analysis, there are clearly limitations – not least that the mode will be heavily influenced by the sports in which there have been a lot of athletes, so we see a lot of the more popular sports in the list.
What makes an athlete?
This exercise also doesn't really give us any proper insight into how these variables affect the chance of getting a medal. To determine this we can use a modelling environment, or more precisely the Apteco Modelling profiling tool.
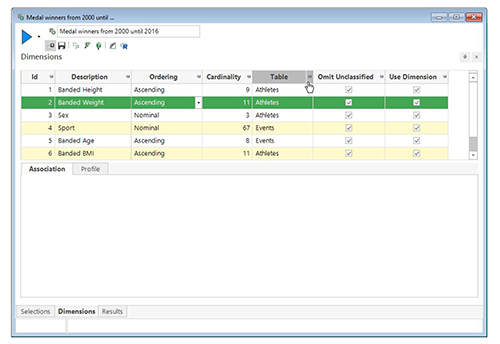
Both the base and analytic selection are all summer events entries from 2000, and the analytic section also filters out all non-medal events. We looked at how weight, height, sex, sport, age and bmi affect the likelihood of obtaining a medal.
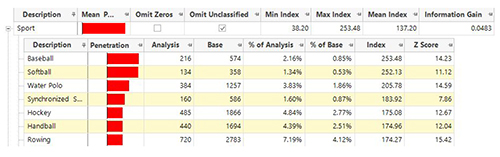
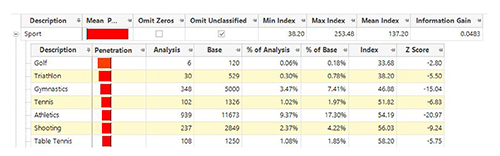
Using the profile tool it appears that the particular sport you choose has the greatest impact on your chances of standing on the podium. Team sports are the most likely route to success, with individual sports – such as triathlon and gymnastics – the least likely.
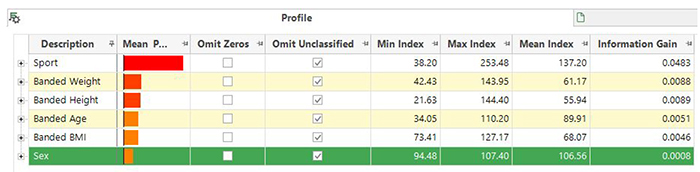
Weight and height were the next most influential variables, with taller and heavier athletes more likely to be medal winners. It's also nice to see that out of our variables, sex is the least effective.
Unfortunately, the success of an athlete isn't always dictated by how much work they put in. This is evident when we look at how the success of an athlete is affected by the country they represent.
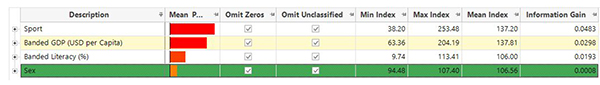
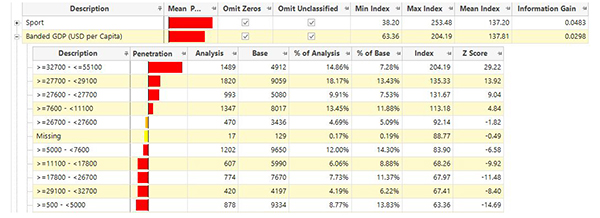
With this profile including GDP (USD per Capita) and literacy (% of population), we can see that athletes in more developed countries are heavily favoured. This is likely to be related to access to greater resources than those in less-developed nations (Note that the GDP banding seems quite erratic – bin size was prioritized over range size).
Conclusion
There isn’t enough space in this blog to detail everything I've discovered, and there’s plenty more to learn from this dataset. Considering how relatively small the dataset is with only 271,116 entries, the data is very rich with information. This made it very enjoyable to build the system and work with it. If I were to continue working with the data I would want to look into the outliers that were discovered in the profiling tool and have a look to see if certain countries are doing better than they are expected to. But then there’s always more to learn from data.
