A question of time: segmentations & customer journeys
13 Jul 2017 | by Chris Roe
Discover how to measure elapsed time in your next Segmentation report in order to enrich the understanding of your customer journeys, and empower your marketing strategies
As its name implies, the ‘Segmentation’ tool allows users to group customers into segments and report on the number of customers in those segments as they change over time. These reporting points are defined as a fixed point in time (for example 01/01/17). The insight that can be gleaned from such analysis can be instructive in terms of the changing nature of our customer segmentation. However, there are a number of interesting questions that it doesn’t allow us to answer.
The fixed nature of the time points means that at any given point in time, all of our customers will be at a different place on their journey with our business. Some may have only just been acquired, others will be about to lapse and some may have lapsed and then re-engaged. Modelling the customer journeys through segments over time following their initial acquisition presents an alternative view.
Answering questions such as ‘18 months after their first purchase, how many people are in each of my 4 customer segments?’ was previously not made possible by the Segmentation tool, because the time points in question are unique to each customer and their individual first purchase date.
This ‘elapsed time’ nature of reporting points is sometimes referred to in marketing literature as ‘Cohort Analysis’. In a chapter of his book Lean Analytics, Alistair Croll states that cohort analysis allows a company to “see patterns clearly across the life-cycle of a customer (or user), rather than slicing across all customers blindly without accounting for the natural cycle that a customer undergoes”.
Typical analytics questions that can arise from this way of thinking are:
- How many people who have registered with our website have then made a purchase?
- How many registered users have made multiple purchases?
- How long does it take to convert our new users into customers?
- What is the average spend in each year for each customer segment at different periods of time after acquisition?
- How many people are in each of my customer segments a year after we have acquired them?
- In the second year of a customer relationship how many people are we losing? How many are we managing to upgrade?
- Over the first two years of a customer relationship what are the most common customer journeys?
- Three years after customer acquisition, how many customers are in our best group? How many of them have been there for less than one year? Or for more than two years?
In the remainder of the blog we will show an example within Discoverer that will allow a marketing analyst to answer questions like those posed above.
Details
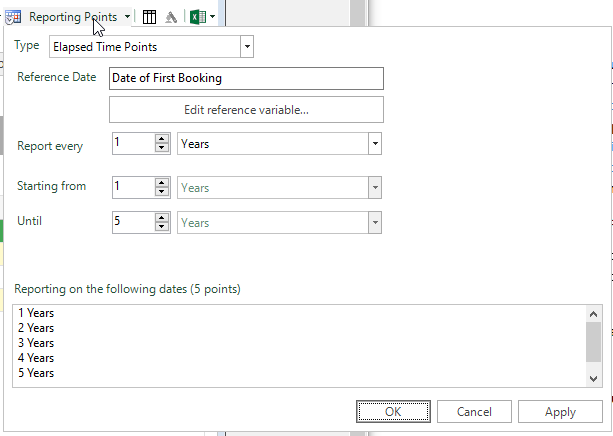
To perform this style of time analysis within the Segmentation tool requires us to think of time in a fundamentally different way. Previously we defined a regular set of reporting points over time (e.g. report on the first of every month from the start of 2012 to the current day). We are now required to think of ‘elapsed time’ from a given reference date. This particular reference date may be when we first became aware of a customer, when we first communicated with them, when they registered on our website for an account, or when they made their first purchase. In the example below, we have defined elapsed time reporting points by choosing to report every year from 1-5 years after the Date of First Booking.
Each of the existing Segmentation time-based reports can now be created with reference to this ‘elapsed time‘ format, as shown in the series of screenshots below that use a Frequency-Value 4-way segmentation split.
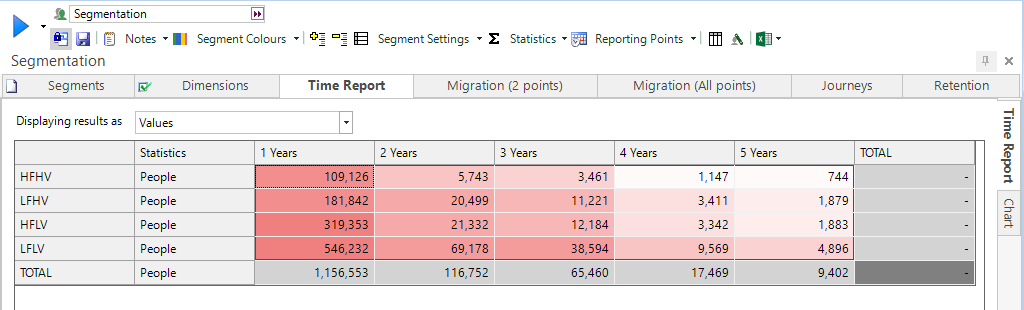
In the time report we can see the numbers of people in each segment after each elapsed year – there is a significant drop in the numbers in each segment with each passing year.
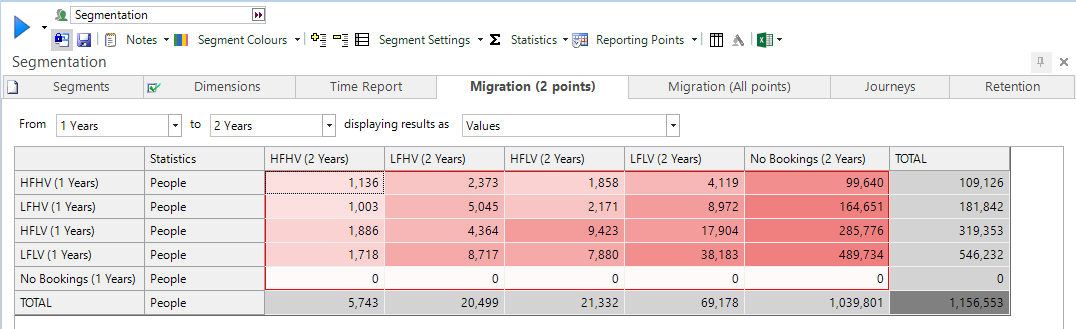
For reporting on migrations we’ve added a further segment to represent people who had no bookings. In the table below we can see a migration pattern between segments that shows that the drop off between Year 1 and Year 2 is largely down to the customers migrating to the ‘No Bookings’ segment.
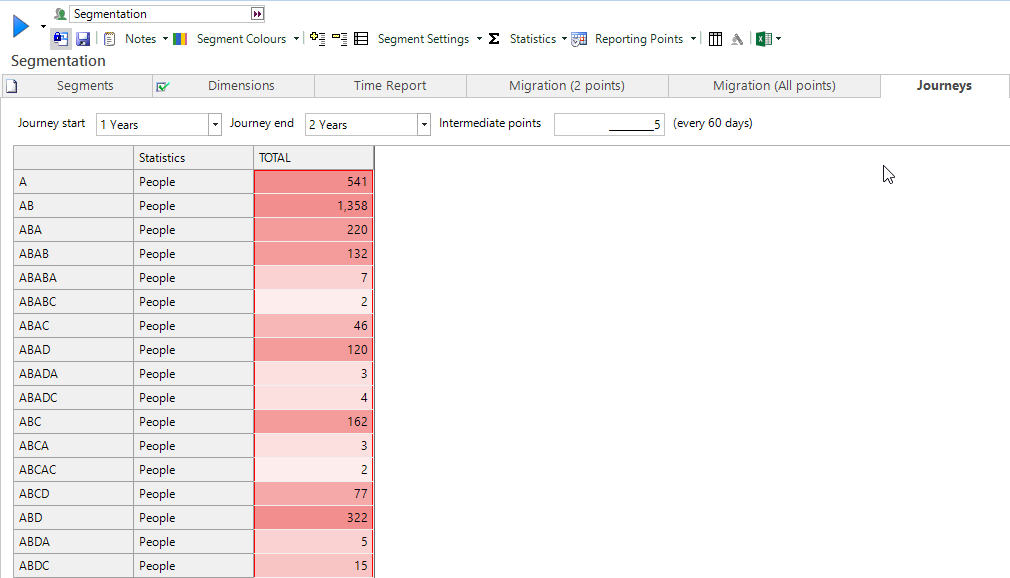
In the journeys report we can see the customer journeys that all customers take in the 2nd year after their first purchase. There were 1,136 customers who were in Segment A after one year and after two years – but only 541 of those were in Segment A when membership was checked every 60 days within that period.
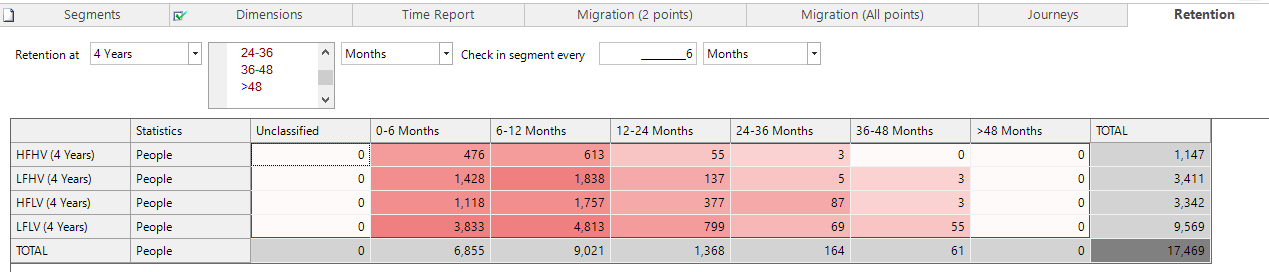
In the retention report we are looking at the segments four years after the purchase date. For each segment we are looking at a banded monthly view of how long customers have been in their current segment. It is clear that the numbers drop off rapidly after 12 months – most people are moving between segments every year.
In this blog we have discussed the advantages and disadvantages of different ways of thinking about time when producing Segmentation reports. The use of an elapsed time approach has specific advantages in spotting patterns amongst customer journeys that cannot be seen when using a fixed time approach. This insight is valuable in understanding more about our customer journeys and in planning future marketing strategies to newly acquired customers.
Explore the competitive advantages of mastering other areas of data and deliver consistently successful campaigns. Download: How to Track Customers as They Take a Journey with Your Business.