CubeLookups: Comparing to an average
13 Nov 2018 | by Chris Roe
A use-case for the less familiar CubeLookup() expression, which can be especially powerful in particular analytical scenarios.
In this blog we’re using a dataset of UK sold property prices from 1995 through to early 2018 (1). This dataset comprises just over 23 million property sales in the UK. There are only a handful of variables provided in the dataset, primarily address and location related data. There are a couple of fields that identify details about the property type, and finally a sale date and the price paid.
Looking across the whole of the data we would find that the average house price is just under £184,000. We could construct an expression to compare each house price to this overall value, but that would be limited in particular scenarios as the house price varies massively across different areas of the UK, as shown in the cube below (2).
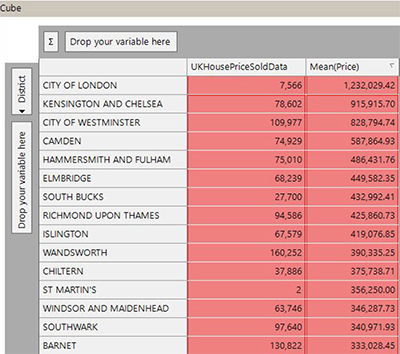
Comparing the value of a house price sale against the overall average will mean that all house prices in these top categories will be considered to be above average, and conversely all of those in the lowest districts to be below average. A more instructive measure would be to compare the price of this house sale against the average across the whole of its relevant district. For instance, a house that sold for £500,000 in Camden would be considered to be £87,864.93 below the average house price for Camden properties.
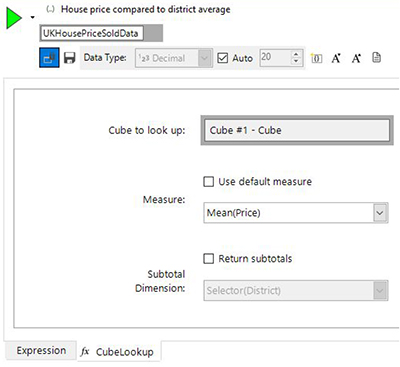
This type of calculation can be performed by using the CubeLookup() expression function. To use it, we add the cube to an expression. A tab is created at the bottom of the expression window where the particular value to be looked up can be specified. In the screenshot below we’ve specified that we’re interested in the Mean(Price) statistic.
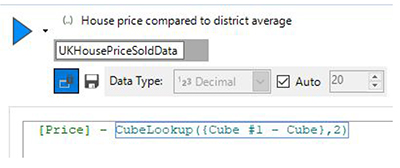
We can then fill in the rest of the expression to perform the required calculation.
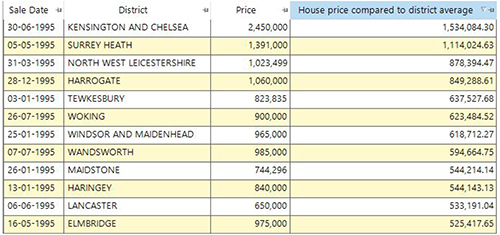
This expression can then be used in any of the usual ways as desired within FastStats. In the example below, I’ve first selected records that were sold for more than the average for their particular district. The DataGrid shows a sample of these records ordered by the difference to the average. The average sale price in Kensington and Chelsea was £915,000 and the particular property in the top line sold for £2.45 million, which was £1.534 million higher than the average for that district.
This is just meant to be an example of how this functionality can be used. In reality you may instead think that because house prices change from year to year, a more accurate result could have been obtained by considering the average house price sale for each district/year combination. This would have been just as easy to do – we would have initially had a two-dimensional cube with the district and banded date axes and the CubeLookup() would have picked out the required value from the 2d cube.
To be more specific, any statistic on the cube that is calculated on the server-side on a non-sparse cube can be used with the CubeLookup() expression. Furthermore, the resulting expression can then be turned into a virtual variable if required as well.
Conclusion
We’ve demonstrated a use-case for the CubeLookup expression function, which allows us to compare the value in a particular record against the value in a particular category. It’s especially useful when used with Mean(<variable>) type statistics for comparison of this record against an average value.
References
- This dataset was taken from the ‘Price Paid Dataset’ at https://www.gov.uk/government/statistical-data-sets/price-paid-data-downloads. Contains HM Land Registry data © Crown copyright and database right 2018. This data is licensed under the Open Government Licence v3.0.
- Note that this data contains not just residential properties, but other commercial properties as well. There are some properties which have enormous values as well which I haven’t checked for accuracy. In the context of this blog post I am interested in the functionality I am demonstrating and not whether we can trust the results of the analysis!