Do You Come Here Often?
21 Jul 2016 | by Chris Roe
Understanding the customer journey is key to effective marketing. Here’s how you can map the journey your customers take.
Introduction
Understanding the customer journey is key to effective targeting. All customers embark on a journey; tracking and analysing this journey can yield valuable insights into customer behaviour and shape future marketing strategies. Additionally, it is useful to know how long you have retained your best customers and to understand the characteristics of these long term customers compared to others. These analytical insights can help guide the marketer to deploy the most sensible marketing messages for customers at different stages of their journeys.
Mapping Customer Journeys
A customer journey is a very individual process. Many customers may share the same start and end points in their journeys but may have travelled to their destination by a very different route. Knowing the common segment journeys your customers take can be helpful in deciding what type of marketing messages are appropriate for each customer based on their current position and their journey so far. Furthermore, if we can identify a particular journey which indicates ‘lapsing customers’ then you can target those that appear to be following this path with timely messages to attempt to influence their behaviour. Repeating this exercise regularly will enable you to check whether you are having an impact in reinforcing positive customer journeys (upgrading) and reducing negative ones (lapsing).
“Understanding common segment journeys enables you to target customers with effective messaging.”
Let’s look at how we can map customer journeys in Discoverer and use this information to our advantage.
Looking at segment movements between two points in time
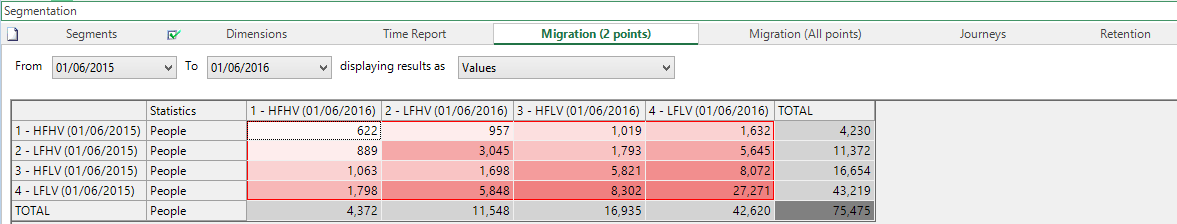
The existing ‘Migration’ tool in the Segmentation tool supported looking at the segment movements between two points in time. For instance, in the above screenshot there are 622 people who started June 2015 in Segment 1 and were still in that segment a year later. Many of these customers may have spent the whole year in that segment. Many others may have downgraded and then subsequently returned to our highest value segment.
Analysing the journey path between two points in time
Discoverer now allows us to drill down and further analyse the journey between these two points. First, we choose a set of points in time between the start and end points and check which segment each customer is in at each point. From this, we can then describe the journey between these two points. By default, we do not differentiate between journeys that go from segment 1->2 by the time in which they undertake that downgrade movement (the tool does support this!). All these results can then be turned into selections in order to aid further analysis or for direct marketing activities.
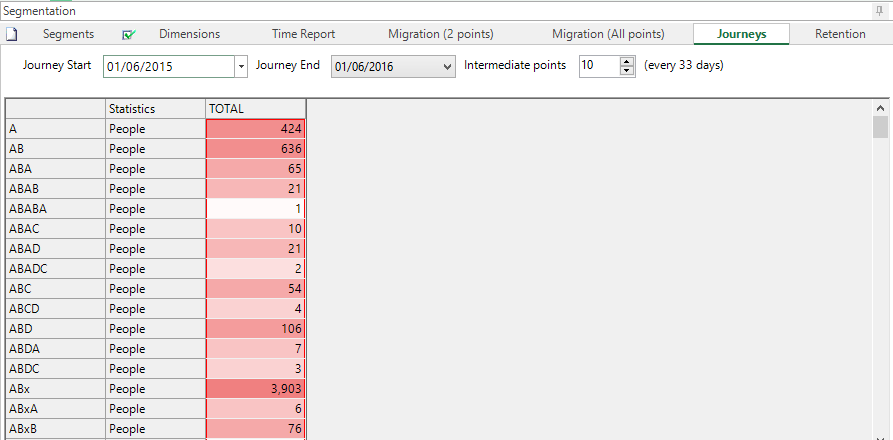
In the screenshot below we have used the same two time points as in the first screenshot. We have chosen to check on segment membership at 10 regular intervals during the year. To ensure that the journey identifiers are of sensible length we have used a lettering strategy to represent the segments. This view shows that, of the 622 customers who started and finished the 12 month period in segment A, only 424 of those were in that segment for all 10 intermediate points. The other 198 customers will have moved out of segment A and then back into it by the end of the period (e.g. 65 customers went to segment B and then back to A).
Segment membership throughout the year
Retentions
Although there are many different figures out there, it is a commonly accepted marketing belief that it costs much more to acquire a new customer than retain an existing one. If we know which customers are our most valuable and also how long they have been in this state then we have an analytical advantage. What are the characteristics of those long term valuable customers compared to the overall population? Or to the newly acquired valuable customers? This knowledge can help in two ways. First, we can look to target those customers with different marketing messages based on their longevity. Secondly, we may be able to predict which of our newly acquired valuable customers are likely to have a long engagement with our brand. Furthermore, by repeating this exercise in the future we can directly analyse whether we are getting better at retaining customers in the high-value segments.
“How are the characteristics of your long-term customers similar to those of new customers? How are they different?”
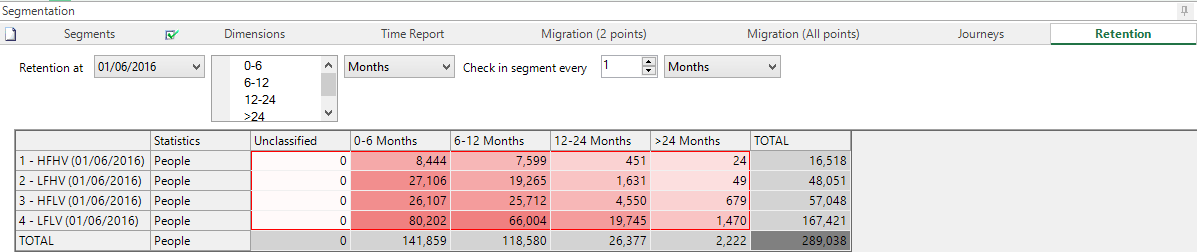
Discoverer now allows this type of analysis within the Segmentation tool. This is an extension of the ‘Migration’ analysis that has previously been supported (where you can look at which segment a customer was in at 2 different time points). Time can be banded into periods so we can group customers by the length of time they have spent in a segment (e.g. 0-6, 6-12, 12-24, >24 months). The retention tool then displays the number of people in each segment in each band. All these results can then be turned into selections in order to aid further analysis or for outbound marketing purposes.
Conclusion
We have described two new additions to the segmentation tool which have enhanced the analysis that can be undertaken with regards to understanding how people move between segments and how long they have been in a segment. This information can be used to both define outbound marketing segments and to gain a deeper understanding of our customers.
Takeaways:
- Understanding the customer journey is key to effective targeting.
- You need to be able to understand different points on the journey, not just the start and end.
- Look at the characteristics of your long standing customers to understand the potential relationship with new ones.
Get the inside track on your customers, download our free eGuide, How to track customers as they take a journey with your business now.