:format(webp))
3 things you can discover about your customers’ journeys with your business
Customer experience cannot be improved without a thorough understanding of customer behaviour. Understanding your customers’ individual journeys with your business is a crucial element of this. In this article, we show three examples of what you can discover about your customers’ journeys and how valuable insights can be derived from the analysis of customer data.
Why customer experience optimisation matters
Optimising customer experience (CX) has become a major priority for organisations. This is no surprise as customer expectations have reached an all-time high within the past few years, impressively demonstrated by a study from Acquia which found that over 66% of respondents could not even remember an occasion a brand was able to exceed their expectations.
Additionally, CX improvements yield many commercial advantages for organisations. According to a recent study by NTT Data, 82% of organisations acknowledge customer experience as a competitive differentiator. Those succeeding in delivering a compelling customer experience benefit from improved customer engagement and report positive commercial effects such as increased customer loyalty (54%), an increase in revenue and/or profits (41%) and reduction in costs (34%).
Expectation vs. reality
However, as promising customer experience optimisation is, it is equally as challenging to implement and measure. The same study by NTT Data reveals that despite the positive effects some organisations are reporting, only 32% state that they are able to perform analyses that consider the data relationships across different touchpoints and only 26% of organisations are able to define and track the value of CX. Without these capabilities though, it is difficult to effectively optimise the customer experience. This is also reflected on the customer’s side – only 12% of customers are saying that they perceive customer experiences as satisfying.
Improving customer experience begins with better understanding how your current customers are perceiving the interaction with your organisation, in other words, understanding their individual customer journey and how they are moving between different touchpoints. Customer journey analytics is a marketing discipline that focusses exactly on that. It provides a wide range of analytical methods to better understand customer behaviour and related aspects, such as what the customers’ goals are, where they encounter friction and even which events cause churn.
Three examples for successful journey discovery analyses
There are different aspects within the field of customer journey analytics and in this article, we will focus on journey discovery. Using a fictitious dataset to illustrate the possibilities, we will show three examples of how you can use your customer data to find out more about the journeys your customers are taking when interacting with your business and the role of different touchpoints within this process.
1. Which interactions have led to a purchase?
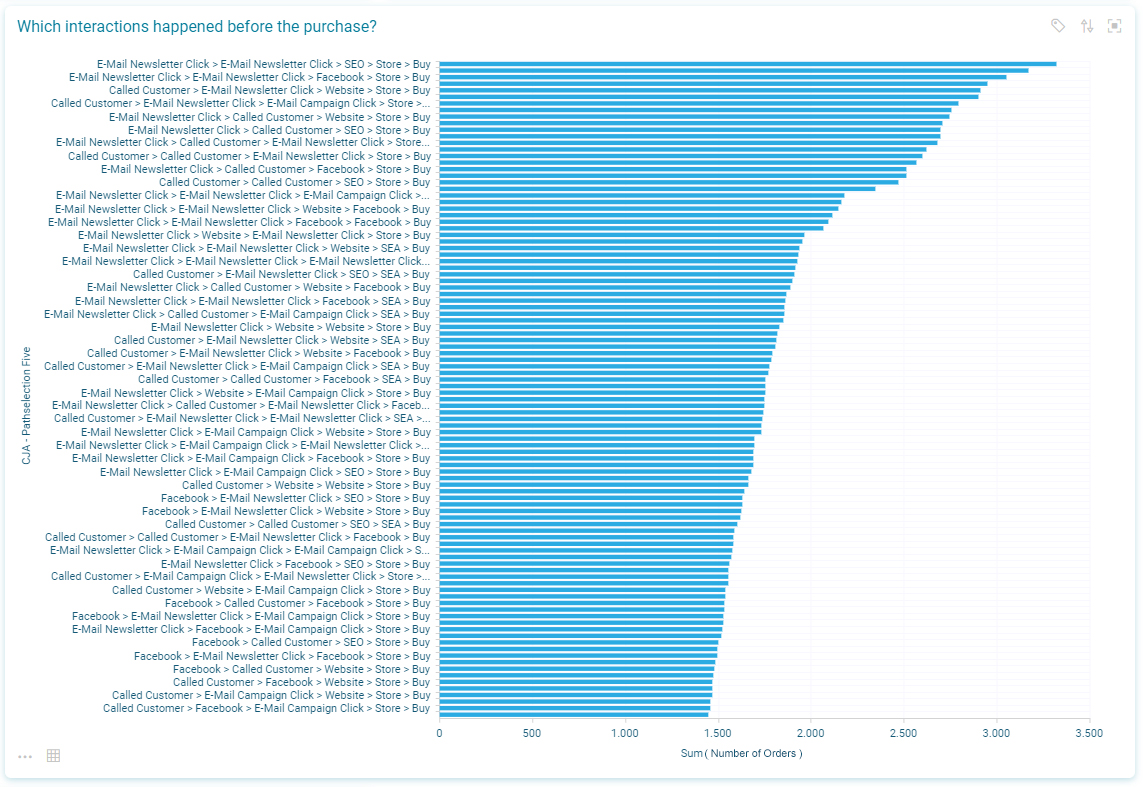
In this first example, we have analysed which sequences of touchpoint interactions have led to a purchase and have sorted these by the number of resulting purchases. For demonstration purposes, this first image shows the top 100 journeys to illustrate how many different touchpoint combinations there are, and that there are quite significant differences in how relevant the different variants are for the total amount of purchases.
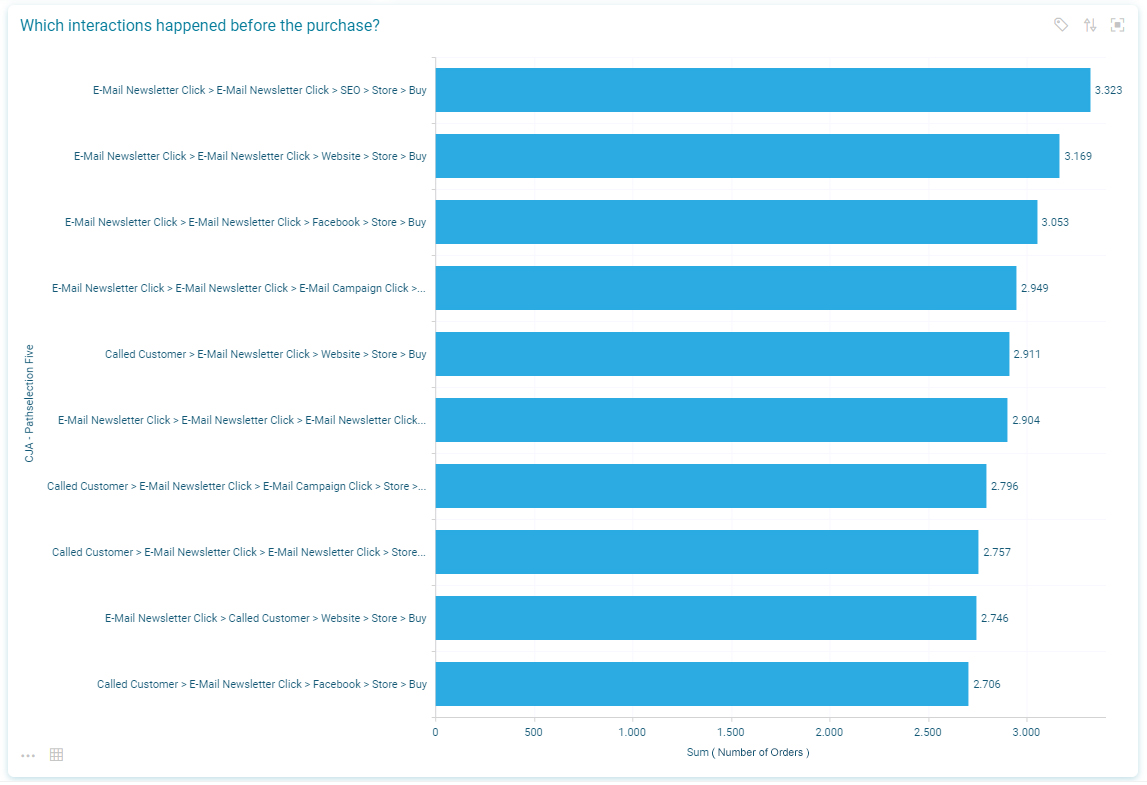
Zooming into the top ten journeys, we get a clearer picture about which journeys are most relevant and which are the related touchpoint combinations. In this example, we can see that although a lot of interactions are happening online in advance, the decisive touchpoint where the purchase happens is the store. This emphasises how important it is to connect online and offline channels and that it is difficult to treat customers as pure “online” or “offline” consumers. It also provides a picture about the meaningfulness of individual channels such as the regular email newsletter and customer calls. Note however, that this visualisation only includes the final four interactions before a purchase takes place. There may be significantly more interactions prior to this that influence the buying decision and not every customer will have the same number of interactions before coming to a decision.
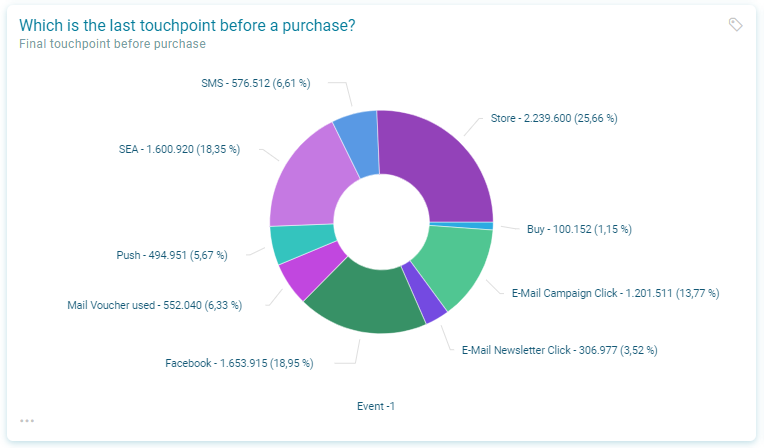
To simplify this a bit further, the following pie chart shows which is the most common final touchpoint before a purchase and again, we can see that the store is the most relevant in terms of the purchase quantity.
These types of visualisations are a powerful way to understand the diversity of journeys taking place and their significance for a business. Another important aspect to consider is data preparation. To present the data in this way, data from each touchpoint is required and all captured customer activities need to be mapped to a purchase. If activities can’t be directly attributed to a purchase, it makes sense to work with time stamps and include them in a logical temporal order.
2. Which journeys have the highest value for your business?
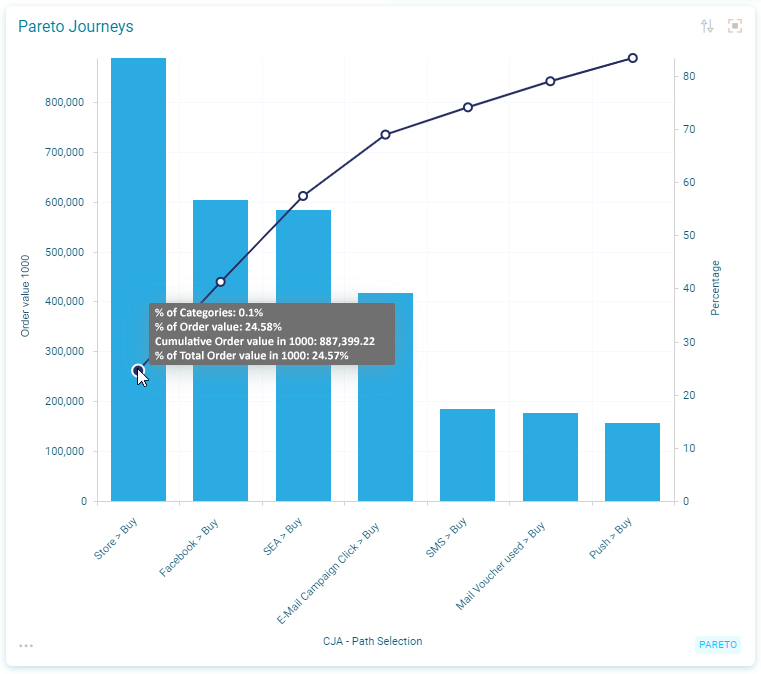
Knowing which are the most common journeys, we can now go one step further and find out what are the most valuable journeys for a business in terms of revenue. In this case, we have used a Pareto analysis to show via which channel the purchases with the highest revenues occurred. Our analysis confirms that stores do not only generate the highest quantity in terms of purchases but also the largest share in revenue. Purchases following a store visit account for 25% of the total revenues, followed by paid activities on Facebook. This demonstrates the importance of considering different measures such as quantity of purchases, revenue or profit when analysing customer journeys. From the first analysis, the significance of Facebook as a touchpoint was not that obvious as it does not account for the largest numbers of purchases, but it became evident when looking at its contribution to the revenue.
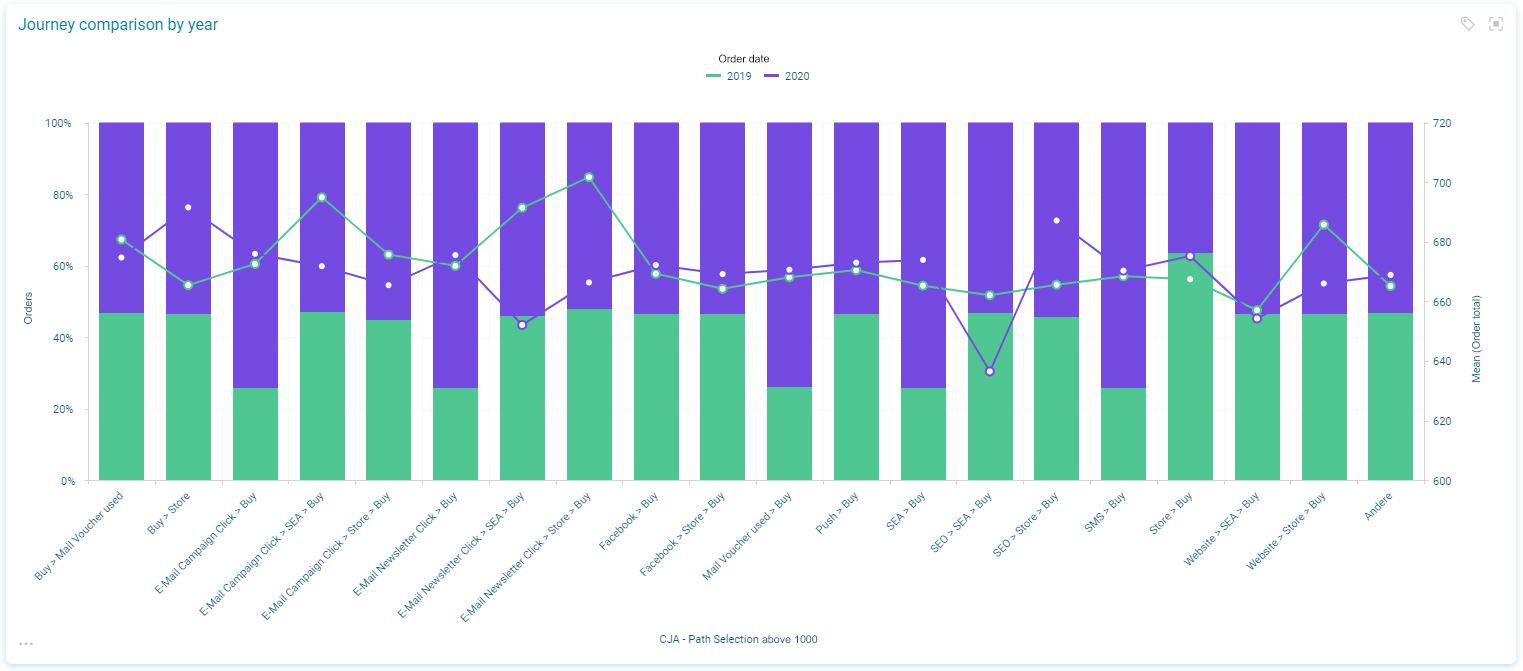
3. How have journeys changed over time?
To identify how marketing measures have affected the success rate of different journey paths, we will now look at how the outcomes of journeys have changed over time. Again, we used the total number of purchases and compared the years 2019 and 2020 against each other. Whereas some journeys resulted in a similar number of purchases in 2019 and 2020, we can also see some significant changes, for example in the journey path “E-Mail Campaign Click > Buy” where the number of purchases increased substantially in 2020. In contrast the journey “Store > Buy” decreased in 2020 in comparison to 2019. For further analyses, a longer timeframe could be considered and more years be added. This is a great way to verify the effectiveness of marketing measures aimed at optimising the customer journey.
There are many more things that can be discovered about the individual journeys of your customers, but we hope this gave you some inspiration on where to start with your analysis and what is possible. Discovering more about your journeys is an important step towards building the foundation for customer experience optimisation. However, apart from discovery and data preparation, there is much more that can be done with customer journey analytics to build on this foundation. From data fusion to journey discovery, generating insights, employing automation and optimisation – we have identified five aspects that characterise successful customer journey analytics.
Download our free eGuide to learn more about how these can be applied in practice and help you to improve the all-important customer experience.
-->
References:
https://www.acquia.com/blog/7-ways-enhance-customer-experience-cx-your-company-delivers
https://hello.global.ntt/en-us/insights/2020-global-cx-benchmarking-report