:format(webp))
Give analysts greater possibilities with derived cube expressions
Introducing powerful new expression functionality that allows analysts to enhance inter-cube calculations.
Giving analysts greater possibilities
Cubes allow analysts to create multi-dimensional breakdowns of their selected data and then show useful metrics on each of the resulting cells within the cube. These metrics could be average values, counts of records, numeric expressions or many others on those fields.
Apteco FastStats® provides users with many common calculations that can be performed on the values within the resulting cube. Regularly used marketing calculations of ratios, differences, rankings, year-to-date type calculations and comparisons are provided in a simple point and click UI.
However, if the particular calculation that an analyst is looking to undertake is not expressible in this form then this cannot be displayed in the cube. The existing ‘Calculated Measures’ functionality is limited to those pre-defined scenarios (*1).
In this post we introduce powerful new expression functionality allowing analysts to create flexible ‘Derived Expressions’ to widen the possibilities for these inter-cube calculations.
New functionality
Let’s take a look at the new functionality that has been added to the expression tool to enable the creation of these derived measures.
Users can create expressions in the normal way using any of the existing functions and then simply drag it onto the centre of a cube to add it as a statistic.
FastStats will recognise that it is an expression calculated from cube elements and add it appropriately to the cube.
We have introduced five new expression functions that can be used to create these derived expressions by returning a value from the cube for every given cell. The functions are:
a) CubeCell
This function is used to return a single value from the cube. It can be a fixed cell value (e.g. a dimension total) or a relative cell value (e.g. the next cell), and can be from any of the measures in the cube.
b) CubeCellIndex
This function is used to return the index of the current cell on a given dimension.
c) CubeCellHeader
This function is used to return the code or description from the current cell on a given dimension.
d) CubeRange
This function is used to return a range of cells from an N-dimensional subset of the cube. This resulting list of values can then be fed into another expression function to return a single value from the list.
e) PeriodToDateCubeRange
This function is used to return a special set of cells from particular date-banded cubes to allow for period-to-date type calculations such as Year-To-Date.
New functions for ‘list’ data
In addition, we have added a further four new functions to act on the ‘list’ data type generated by functions (d) and (e) above:
f) RankList
This function will rank a particular value from a given list. The order can be set to ascending or descending as required. Further control can be given on how to deal with ties in the data values.
g) NTileList
This function will work out which N-tile a particular value is in from a given list. The order can be set to ascending or descending as required.
h) FilterList
This function will take a list of values and remove values that fall outside of a given range. This function is useful for removing outliers from a list.
i) TrimList
This function will take a list of values and remove a certain number of them, or a certain proportion of them. This function is useful for removing outliers from a list.
Finally, we have extended several other expression functions to allow them to take lists as parameters. This is necessary as each cube cell result has to be a single numeric value. When a list of cells is returned from, say, the CubeRange function, we can then calculate a Sum, Mean, Max or Min for example.
Some examples
Let’s now flesh out some of the functions described in the previous section and explain how they can be used in three different scenarios:
a) Rank of year-to-date (on booking month)
The calculated measure ‘Rank’ can be used to rank a value across a dimension, but this is restricted to specifying all the cells across a given dimension. By using the new expression functionality we can specify a subset of cells on a dimension and rank from that subset.
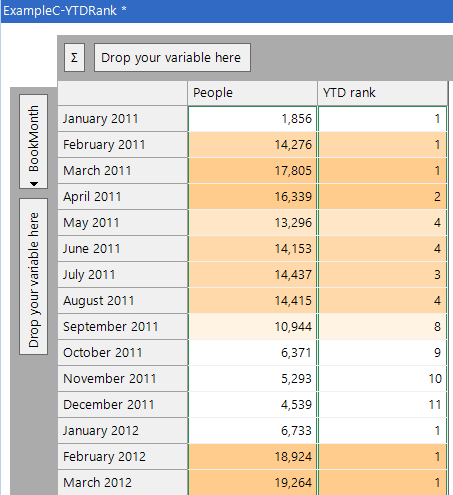
In this example we use our booking date variable and band it into months. We then want to work out how this month compares to the previous months this year and return this as a rank. Clearly January each year will always have a value of one. February will have a rank of one if it is higher than January, otherwise it will have a value of two. December can only have a rank of 12 if it has the lowest total for the entire year.
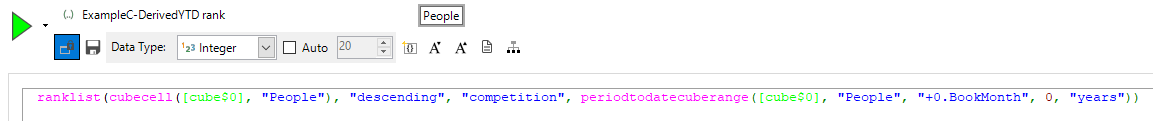
The expression to achieve this is shown below. We use the ‘PeriodToDateCubeRange’ function to create the list of values for the year-to-date, and then work out where the current cell is in that ranked list.
The resulting cube is shown below. December 2011 has a rank of 11 as it is smaller than all other months in 2011 apart from January. However, January had a rank of one as it was the best month in the year-to-date (as it was the only one!).
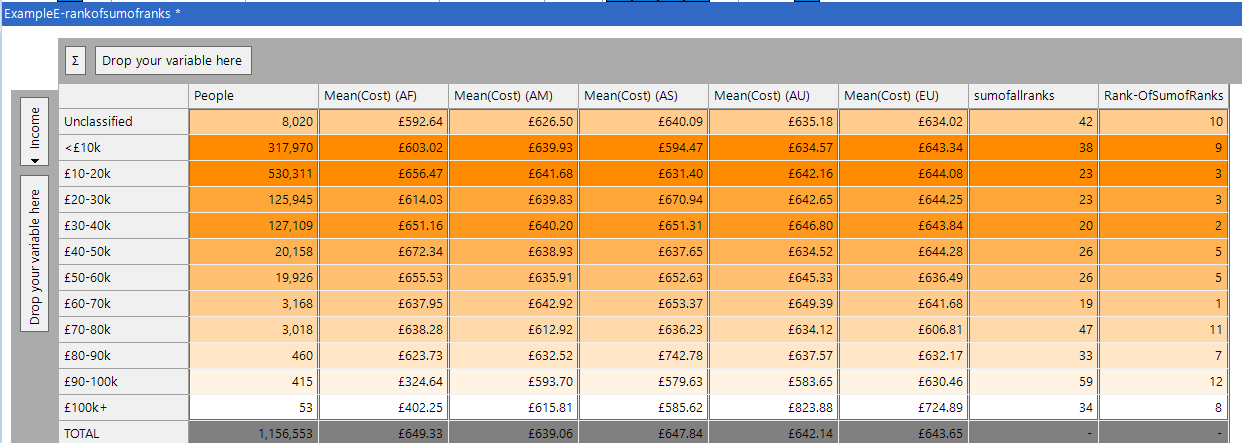
b) Rank of a sum of ranks
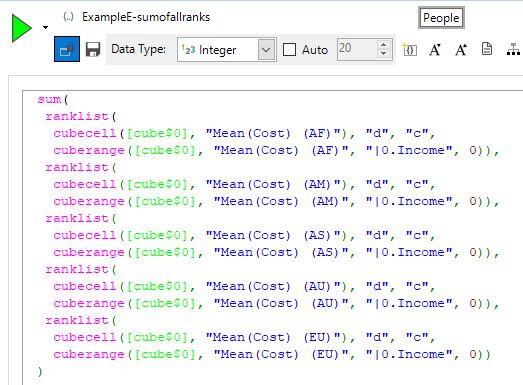
This example also uses the RankList() function. Note that in the function below I have used ‘d’ and ‘c’ as shortcuts for descending and competition respectively.
The purpose of showing this example is twofold:
- The first expression shows a much more complex expression in which we are finding five different ranks (the Mean(Cost) for each continent) and then summing them together within a single expression.
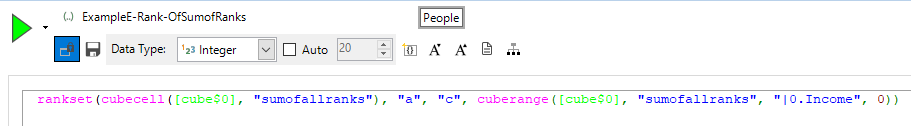
- The second expression shows how a derived expression can then reference another derived expression. In this way we can construct powerful linked expressions for some of these cases.
I have added this measure to the cube and called it ‘sumofallranks’. This second expression takes the resulting value and creates its list from the ‘sumofallranks’ measure.
The resulting cube is shown below, and we have shown the two measures in the final two columns. This calculation could have been achieved with the existing functionality but it would have needed 10 calculated measures to achieve the same end result.
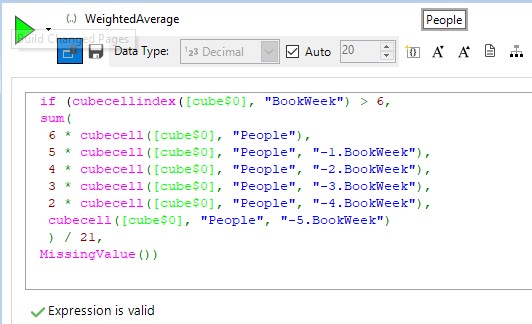
c) Weighted average
In this final example in this section we produce an average for a cell based upon it and the previous five cells in which the weighting applied to each cell decreases in line with its age. This type of ‘smoothed’ or ‘weighted’ average can be seen in many scenarios where we seek to limit the influence of occasional outlying values, or in ranking systems (such as seen in golf for example).
Here we use the CubeCellIndex function to firstly omit doing the calculation if we don’t have enough values, and then we use relative cell references and multipliers to perform the calculation.
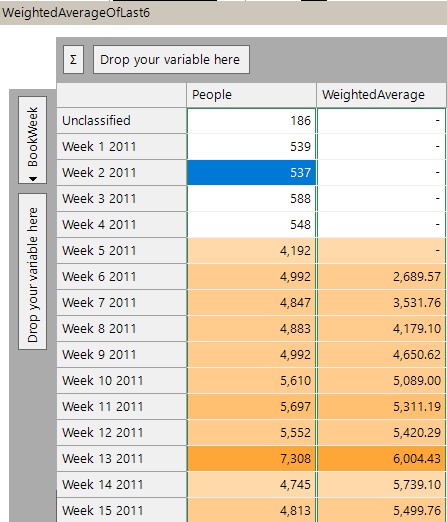
Here is the resulting cube.
These examples are just some of the possibilities with this extended functionality. Some further interesting examples would be:
a) Ranking across 2D ranges
b) Comparison to a fixed value but such that cells before it are blank
c) Using CubeCellHeader to drive a Case() expression that could then do something different for different product groups or years etc.
Templating
In all of the examples we have shown so far we have referred explicitly to dimensions and measures by their names. This is usually the most sensible way to use these functions as we are aiming to produce a specific result for a particular cube.
However, there may be scenarios where we effectively wish to make a template to express the structure of the cube and the derived expressions in it, but wish to give ourselves the flexibility to replace dimensions or measures. In all of the examples described in the previous section we have explicitly named both the dimensions and measures. If we wanted to replace that named dimension on the cube we would need to also edit all of the derived expressions that refer to it if we wanted to reuse them.
By referring to measures by their numerical position, and dimensions by their numerical position (vertical dimensions first) we can make a more general expression.
Here is an example of a simple Rank on measure two across the whole of dimension one.
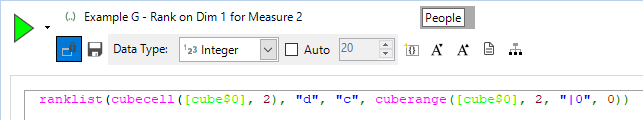
Here is the resulting cube:
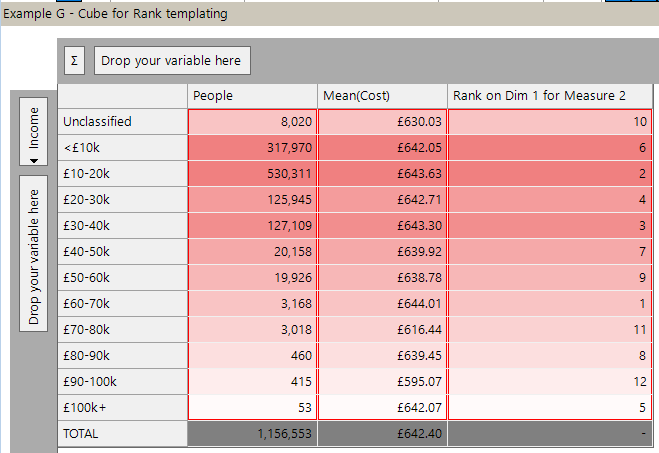
We are free to replace Income with Occupation, or Mean(Cost) with another measure and the Rank measure will calculate correctly without need for any editing.
Conclusion
In this blog post we have introduced functionality that was introduced to FastStats in the Q4 2019 release. This functionality enables analysts to create new statistics in cubes that have values derived from other statistics in a very general way.
I am interested to see what you can use these functions for – I’d love to hear what you do!