:format(webp))
Grouping Aggregations
In this blog we introduce new powerful functionality for transactional analysis based upon grouping transactions into categories and returning values based on them.
Segmentation by understanding the differences between their transactional behaviours can be a way of treating customers in appropriate ways based upon their prior purchasing behaviour.
FastStats already has a number of different techniques for aggregating transactional values and returning a result for each customer record. These range from simple aggregations such as counting the number of transactions a customer has had, through to sophisticated pattern match aggregations as described in a previous blog (see 1).
However, there are still a class of problems which are still difficult to solve using the existing aggregation techniques. This type of problems is exemplified where we need to work out the value of something for each product type. For example, which product have I bought the most of, or which channel have I mostly responded too. To solve those problems currently, we would need to create an aggregation for each type using a filter selection and then combine them using the function we need. As soon as we have more than a handful of product types this becomes too difficult.
In this blog, we will consider these types of questions that are now answerable with the new grouping aggregation functionality:
- What is the most that a person has spent on a particular product?
- Which product was our 2nd most frequently purchased by each person?
- How many products have I spent more than a given amount on?
- How many products have I bought multiple times in multiple years?
A Simple Explanation
For each person we firstly take all of their transactions and group them by a selector variable – in our case we are going to use the Destination to split the transactions up. We then apply a function to each of the transactions and summarise those within each group. In the diagram below we have worked out the cost of each holiday and then worked out the Sum of each group as shown in the purple blocks below.

Once we have these group results we can then apply a further function to get an end result. One such simple example would be to return the Maximum value – this is then the ‘most we have spent on a destination’. For the person above that value would be £4000.
Worked Examples
Let’s see this in action on our example Holidays system.
- What is the most that a person has spent on a particular product?
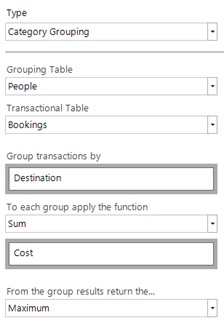
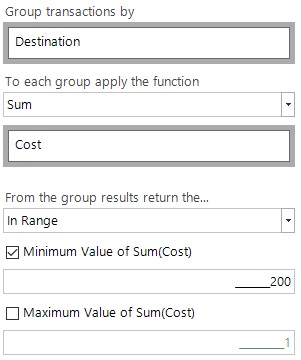
This example is the one described in the previous section. We can set this up in the interface using the choices in the screenshot below.
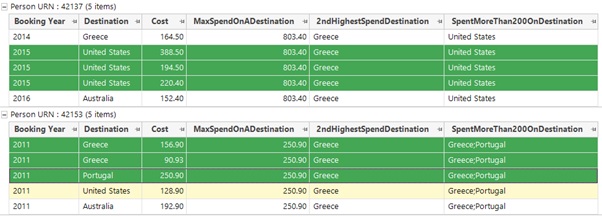
A couple of example people are shown below. The highlighted transactions are those to their highest-spend destination. We can see that for the second person their one holiday to Portugal has cost more than the total of the two holidays to Greece.
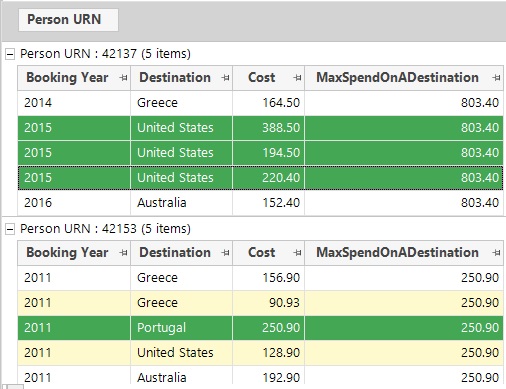
If instead of choosing the Sum(Cost) to each Destination we had chosen the Frequency(Bookings) as our function to apply at the first stage, then the 2nd person would have had a value of 2 – as represented by their two holidays to Greece.
Let’s look at some other examples of functions that we can apply to those group results. In all of these examples we will use Destination as our grouping variable and the Sum(Cost) function to work out the value associated with each group.
- Which product was our 2nd most frequently purchased by each person?
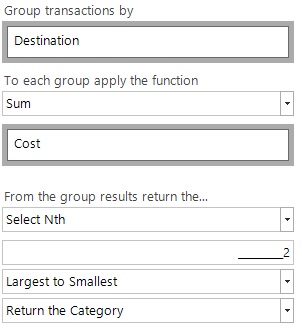
Instead of returning a Maximum() function we use the SelectNth() function and choose the 2nd when ordered from Largest to Smallest. I have chosen to return the actual category value, but I could have also chosen to return the numeric value.
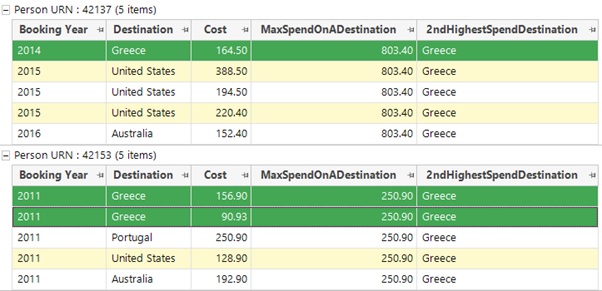
Below is a screenshot showing the same 2 people as above, but now we can see highlighted the transactions that contribute to Greece being recorded as the 2nd highest spend destination for both of these 2 people.
- How many products have I spent more than a given amount on?
In this example we will build on the previous analysis and find all of the destinations where the Sum(Cost) is over £200. For this we can use the InRange function and set a minimum threshold value for the group results.
This example is slightly different in that it could return anywhere between 0 or all of the possible destinations, so a flag array will be created of the Destinations that meet our required criteria. We can then use existing expression functions to count the populated flags (How many destinations have we spent more than X on) or to simply list them out as we have done in the screenshot below. Our two example people have 1 and 2 destinations respectively for which they have met the required criteria.
- How many products have been bought exactly 2 times in multiple years?
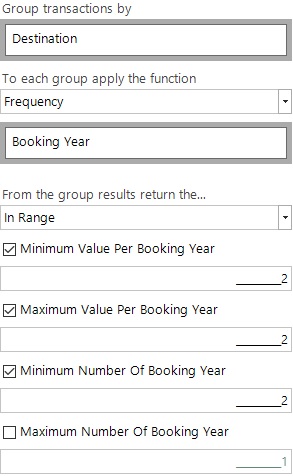
In this final example we extend the scenario further by using 2 categorical variables. We start with the existing grouping into each Destination. We then need to work out the number of times we have visited each destination in each year (essentially a 2D cube for each person with a count measure) by using a function of Frequency(Booking Year). We apply a range to the individual destination/year combination to ensure that there are exactly 2 visits, and then to the number of years which are populated to ensure a minimum of 2, as per the interface below.
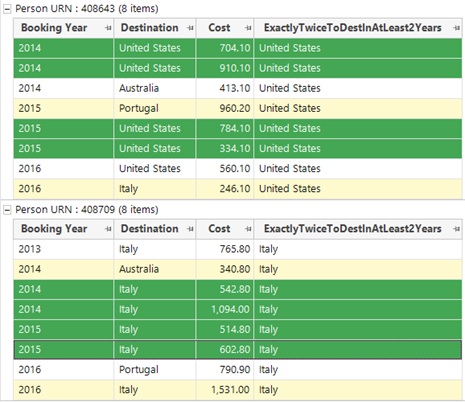
Again, the result will be a flag array since each person could have 0, 1 or many destinations which satisfy the above criteria. In the example below, I have highlighted two people with 1 destination matching the criteria, although the destination is different in each case. Note that for both people they have had further bookings to each of the destinations but they did not match the range for the first part of the condition so had been removed prior to the number of years range being matched.
It is possible to select people who have for example booked exactly twice to a destination in 2 separate years and not at all in any other years by combining this with a further grouping aggregation.
In this 2 dimensional case there are other functions which can also be used instead of this InRange example as shown in the football section that follows.
Football Statistics using Grouping Aggregations
We have used the football system in some of our earlier blogs as it has a rich set of transactions (“matches”) for each person (“team”). Many English club teams will have had over 4000 matches in over 130 seasons and have recorded over 100 different scorelines in that time.
In this section we will look at some new questions that we can now answer quickly using this Grouping Aggregation functionality.
Here are 4 interesting (well to me at least!) English football statistics questions:
- What is the maximum number of occurrences of the same scoreline in any English league football season for any team since WW2?
- What is the maximum number of different scorelines in any English league football season for any team since WW2?
- Has any team recorded a particular scoreline in every season since WW2? If so, what is the most number of times a scoreline has been recorded in every season?
- When was the last time an English league football team recorded the same number of Wins, Draws and Losses in the same league season?
For the first 3 questions we need to analyse based upon 2 factors (scoreline and season), in the same manner as the example from the previous section. Since WW2 there have been 73 completed seasons (this blog written before the end of the 2019-20 season) and 83 different scorelines that have been recorded in English league football.
To answer the questions above we are effectively producing a 2D cross-tab for each individual team and then completing the analysis from there. Here is an example from one team. I have sorted the results based on the total overall scorelines for this team, so we can see how their most recent seasons have compared to their overall record.
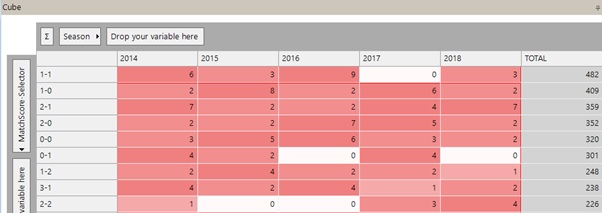
In question 1 for example, we are looking for the highest value in the full cross-tab above across all the possible teams. We use the Maximum function across the 2D cube of Scoreline v Season and then we can return each of the possible values (the numeric, the scoreline or the season)
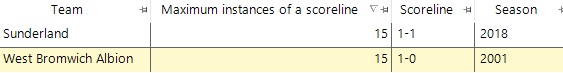
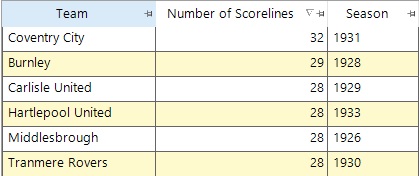
For question 1, 2 teams have had 15 occurrences of the same result in a given season:
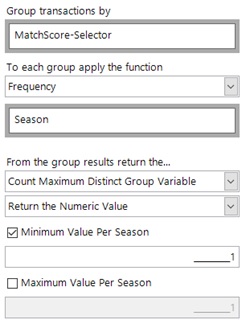
For question 2 we are interested in the ‘maximum distinct count’ of scorelines in any season using the following settings:
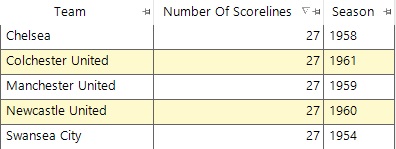
For question 2, there are 5 teams that have had 27 different scorelines in the same season:
If we look earlier than WW2 we find several teams who can do better than this as the further we go back the more ‘outlier’ scores we find:
For question 3 we want to make use of the InRange function across the dimensions of scoreline and season. Again, we need to group by match scoreline and return the frequency of matches in every season. We then need to have 1 instance of a scoreline in every season for at least 73 seasons (i.e all of the completed seasons since WW2).
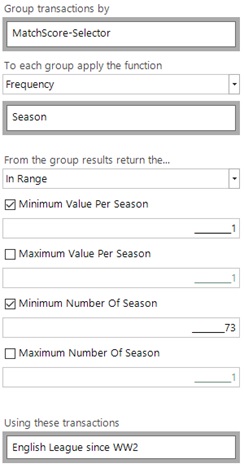
We can then add the expression containing this aggregation to the selection and choose teams who have at least 1 such scoreline. If we also add a second version showing the number of populated scorelines in the grid we can then see the 47 teams separated by the number of different scorelines that have occurred at least 1 time in every season, as follows:
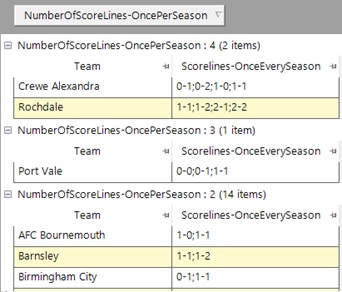
Crewe Alexandra and Rochdale only managed to achieve 3 of their 4 scorelines in the curtailed 2019-20 season, so will drop down to join Port Vale on 3!
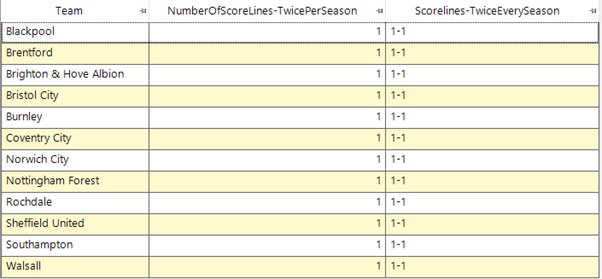
From the initial aggregation if we now change the minimum value from 1 to 2 we change the question to look for teams which have had a scoreline 2 times in every season. We can then see that there are only 12 teams have had a scoreline 2 times in ever y season since WW2.
Repeating the above technique we would find that there are no teams who have had the same scoreline 3 times in every season.
We can work out which ones was closest by using the Maximum Distinct Count function, and we find the following:
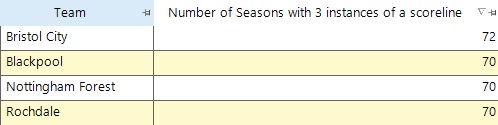
Bristol City have done it in 72 of the seasons, and only fell short by recording just 2 1-1 draws in the 1957 season. They have also achieved this feat in the (now completed) 2019-20 season.
For question 4 we need to look at different results (Win, Draw, Loss) rather than looking at scorelines. We can also use the knowledge of the English football league structure to know that since WW2 there have only been divisions with certain numbers of teams (e.g. 20, 22 or 24 teams, which correspond to 38, 42 or 46 matches). Therefore, only one where we can have the equal number of results is the middle one in the list above (i.e having 14W, 14D, 14L in a 42 match season).
Using this domain knowledge we can set up an aggregation as follows, and we need each result type to be exactly 14 (since a 46 match season could have 14-15-16 for instance), and this needs to happen for all of the 3 possible result types.
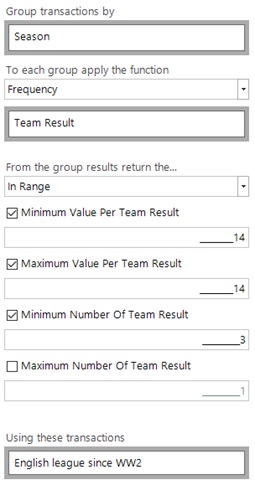
We find there are 15 separate teams who have achieved this since WW2, but no team has ever done it twice. Coventry City are the most recent team to do this, but that is now over 25 years ago! This is primarily because there have been no divisions with 22 teams for many seasons now.
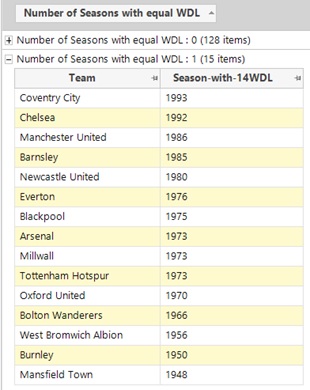
Taking a closer look at Coventry’s records by season we see that they did indeed have the required property in the 1993 season.

Conclusions
Interesting English football statistics aside, this blog has demonstrated a powerful new analytical capability for analysing transactions when they are initially grouped into categories. It should enable clients to look more closely and differentiate their customers based on their transactional activity and take appropriate action from this insight.