:format(webp))
Squabbling Siblings – play nicely together
Squabbling Siblings – Create better data outputs by getting child tables to play nicely together. Bring multiple child tables together in a Data Grid with ease thanks to the latest update in Discoverer
In Discoverer, Data Grids allow users to see attribute details of the records that are currently selected.
Data Grids have two primary uses. Firstly, they can be used to help users justify that their selections are correct and that their logic has picked records that have the characteristics that they were expecting.
Secondly, they are used as the mechanism for exporting data records out of Discoverer for marketing purposes – for instance to be uploaded to an email broadcaster for a campaign.
“Data Grids have two primary purposes - justifying selections and exporting data records for marketing purposes.”
Attribute details that are included within the export data can then be used within the message that is sent out. Typically those attributes will include customer data such as name and addresses.
Often, there is a need to include transactional level data, such as last product bought or last purchase date, within the message to increase personalisation.
Occasionally there is the need to include transaction level detail from multiple different sources (e.g. last product bought, last communication date, last website visit etc).
Previously producing data grids that include these details has been difficult, but in this blog, we introduce a new development that will make this a lot easier.
Details
In this section, we will describe the process for creating a data grid with transactional information from multiple child tables. We will use our standard training fictitious holiday company dataset.
This dataset includes people who have potentially had multiple bookings, multiple insurances and multiple communications.
Example table structure:
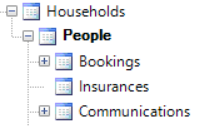
What are we trying to do?
We are trying to create a grid that has a person’s name and address together with the last destination they visited, the date on which they visited, the last insurance they bought and the date on which they bought it.
This necessitates aggregated information from two transactional tables.
Previously…
Previously in Discoverer a user would have had to use the Recency Wizard to create an aggregated version of the fields needed from the second transactional table in order to create the required grid.
From the Q3 2016 release we can create these aggregated fields directly within the grid itself.But now…
In the People grid below we have firstly added in the customer personal details we need and then added in the first two fields from the Bookings table (Destination and Booking Date).
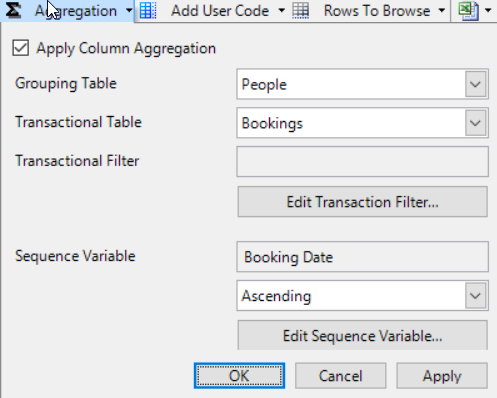
We can change the grid to show people and then apply the aggregation from the toolbar from Bookings->People and order the bookings by Booking Date.
Example table structure:
The next step is the first new extension – we can now also add the two fields we need from the insurances table to the grid and a default aggregation will be applied to both of these new columns.
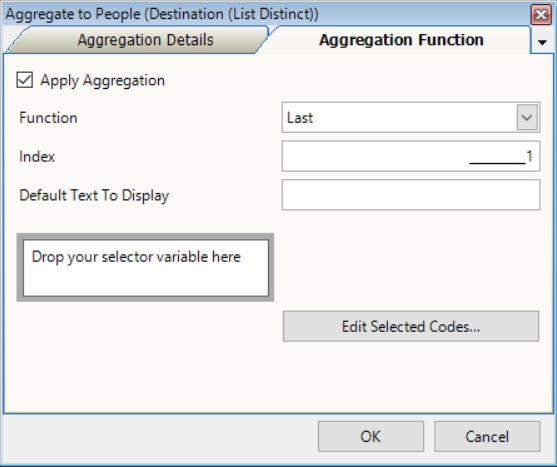
If we select both of the Bookings columns and right-click on the column headers for the bookings fields to edit the aggregation we can change the function to ‘Last’.
Example table structure:
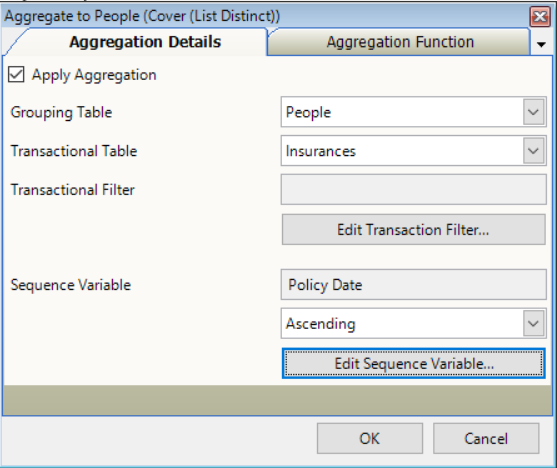
Then we can repeat this step for the two insurance fields.
However this time we need to also specify which Insurance field to order those transactions by (the Policy Date) as well as choose the Last.
Example table structure:
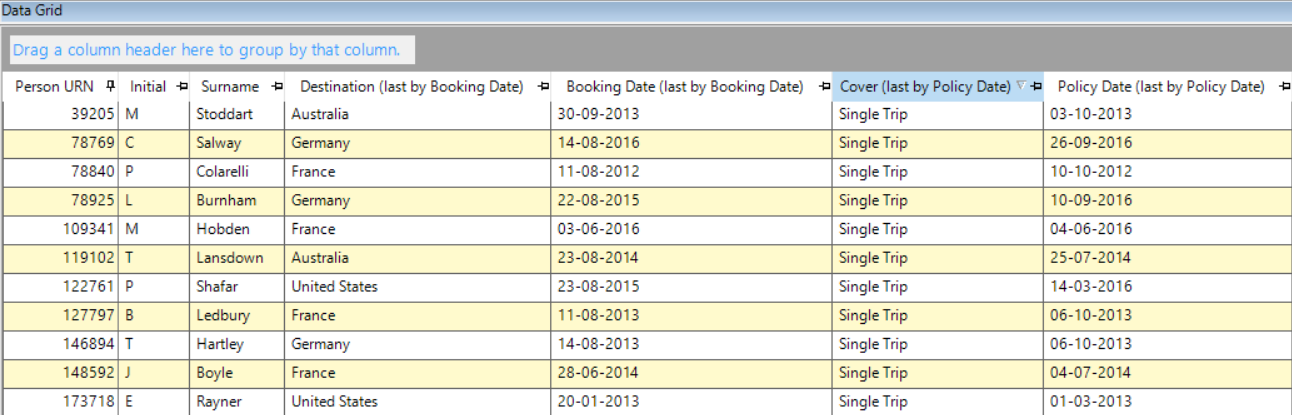
Running the grid (and I’ve sorted the result) will give a screenshot as below with the information that we require.
Example table structure:
This section has given a walkthrough of the steps needed to create the basic actions we need to take to aggregate fields from multiple child tables.
Each column within the resulting grid can potentially be:
- From a different transactional table.In our example we have just used two tables, but we could have also included aggregated information from the Communications table, or any other table that is a child of the People table.
- With a different transactional filter selection.This allows for instance multiple columns to be defined as the last purchase date for particular product types.
- With a different variable used to sequence the transactions.This allows for instance multiple columns to be defined such as the last destination visited, the destination with the highest cost etc.
In designing this improvement to data grids we have tried to make this extension as natural as possible.
For users who only ever need to aggregate from one transactional table the process remains virtually the same, with only a small change to the editing aggregation function dialog (which many users may not even spot).
For users who need this new development the primary aim has been to make this easy for users to discover with sensible default choices and familiar dialogs. Hopefully we have succeeded!
In this blog we have discussed how we can use aggregated fields from multiple child tables in data grids.
This means we have easier ways of producing output files which contain such fields than have existed previously.
Takeaways:
- Data Grids help users justify selections and as a mechanism for exporting data.
- The new updates in Discoverer enable users to create aggregated fields directly within the grid.
- This extension enables output files containing more variants of information in an easier manner than before.
See the benefits that data driven marketing can bring to your business, download 'Trend Report 2016 Data driven marketing’