:format(webp))
Storytelling in full colour
Why are the colours you choose in your data visualisations so important? Discover in this blog why colour selection is not merely an aesthetic choice but a crucial tool to convey information in your data visualisations.
Can you remember the stories you heard as a child?Think back to the part colour played in those stories. Without even thinking about it, we identify villains and heroes by the colours they wear. Colours in stories, fairy tales and fables aren’t simply for decoration. They transmit important information and provide emphasis.
Would Batman be so dark and mysterious without his black cape, Superman so iconic without his red and blue, Jessica Rabbit so fiery and seductive without that red hair?
Colour is an incredibly powerful form of communication and plays a vitally important role in the world in which we live. Colour can sway thinking, change actions, and cause reactions, and there are many scientific studies to show that colour has a direct impact on the way our brains process information.
So why is it that the use of colour is often underestimated, even thought of as unnecessary, merely as decoration, in corporate settings?
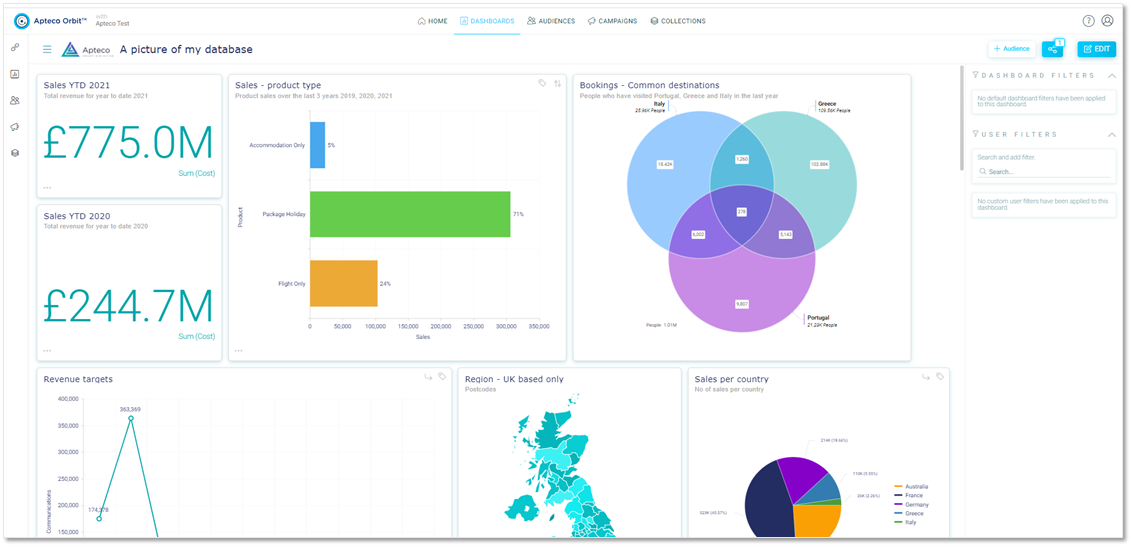
Data visualisation is critical in today’s business environment and colour is a fundamental part of communicating those findings
Colour (when used correctly) can be a powerful tool for data visualisation, and it can help to make your data story pop out of your dashboard. A great palette of colours will aid the story you are trying to tell, while a mismatched or haphazard selection will distract and obscure the key messages.
Data visualisations provide viewers with a quick digestible visual snapshot of often complex information. Using colour can arguably help more than any other design element to aid viewers in the understanding and impact of what is being presented, and crucially helps them to remember it too. In fact, studies have shown that using colour strategically can increase memory, aid pattern recognition, and attract attention to priority information.
So why would you not take time to carefully choose the story that your dashboard and visualisations portray to viewers? Why spend hours on analysis only to lose your audience to boredom or confusion? Colour is a major factor in creating effective visualisations. The challenge is to use the power of colour effectively to communicate the message you want to send.
Does red really raise your heart rate?
Colour has clearly been shown to have a direct effect on human biology and psychology and can evoke a series of different emotions. Certain colours are also more appropriate in some industries and cultures than in others. Rather than aiding understanding, some colours and colour combinations will confuse, distract or even offend people. When designing your dashboard, you need to consider who your audience is and how they will be affected by the colours you choose.
For example, in some cultures the colour purple is synonymous with royalty, wealth and wisdom, whereas in Thailand the association is of mourning. In East Asian stock markets, red signifies a rise in stock prices, whereas it signifies a fall in North American markets.
Colours can also be controversial
Yellow is said to be the most visible colour and has the advantage of stimulating clear thinking, so could be used when you want your audience to remember one main point or message. Yellow is also associated with the intellect and logic and is said to have the ability to improve analytical thinking and fast decision making.
However, it has negative connotations too.
Many cultures associate yellow with cowardice or treason, and it is even found that babies cry more in yellow painted rooms and that people tend to get angry when around this colour for too long.
By understanding the impact colours like yellow may have on the viewer, you can determine which course of action is best and perhaps choose to use it sparingly to highlight critical information.
“Colour selection in data visualisation is not merely an aesthetic choice, it is a crucial tool to convey information.” Earth Observatory, NASA
Colours speak louder than words
Colour is arguably one of the most important elements in your data visualisations and can speak to your audience in many ways turning an unassuming visualisation into an emotion-filled data story.
Whether we realise and appreciate it or not, all of us associate certain brands, locations, foods, teams etc with colour. Examples of this include political parties, sports teams, environmental topics and many more. These associations can help you bring information to your audience more easily, make it more accessible and more memorable.
Used correctly, colour will enforce the story of your underlying data – helping your audience to remember key points and making patterns more visible, digestible, and clear.
Here are a few tips to help guide you on your data story telling journey:
1. Always make your brand the hero
Choose colours that reflect your company’s brand, industry, or product. Branding is an essential component of any business and colour in data visualisations helps to shape the message of a consistent brand. To maximize stand out, avoid choosing colours that are too similar to your competitors.
Tip: You can easily create your own custom themes using your brand colours, fonts and logo in the application settings in Apteco Orbit dashboards.
2. Select colours with care
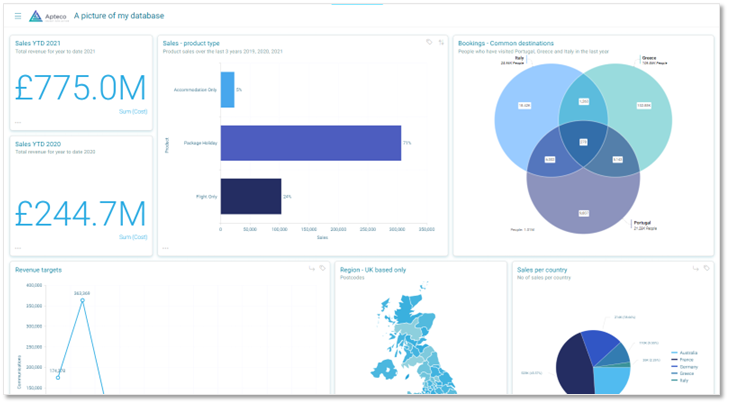
Be careful when selecting colours to ensure that get the right message across. Take into account your audience, brand, competitors, region etc. Also consider how you want your audience to feel – for example, blue could help your audience to relax whereas yellow could generate excitement and fun.
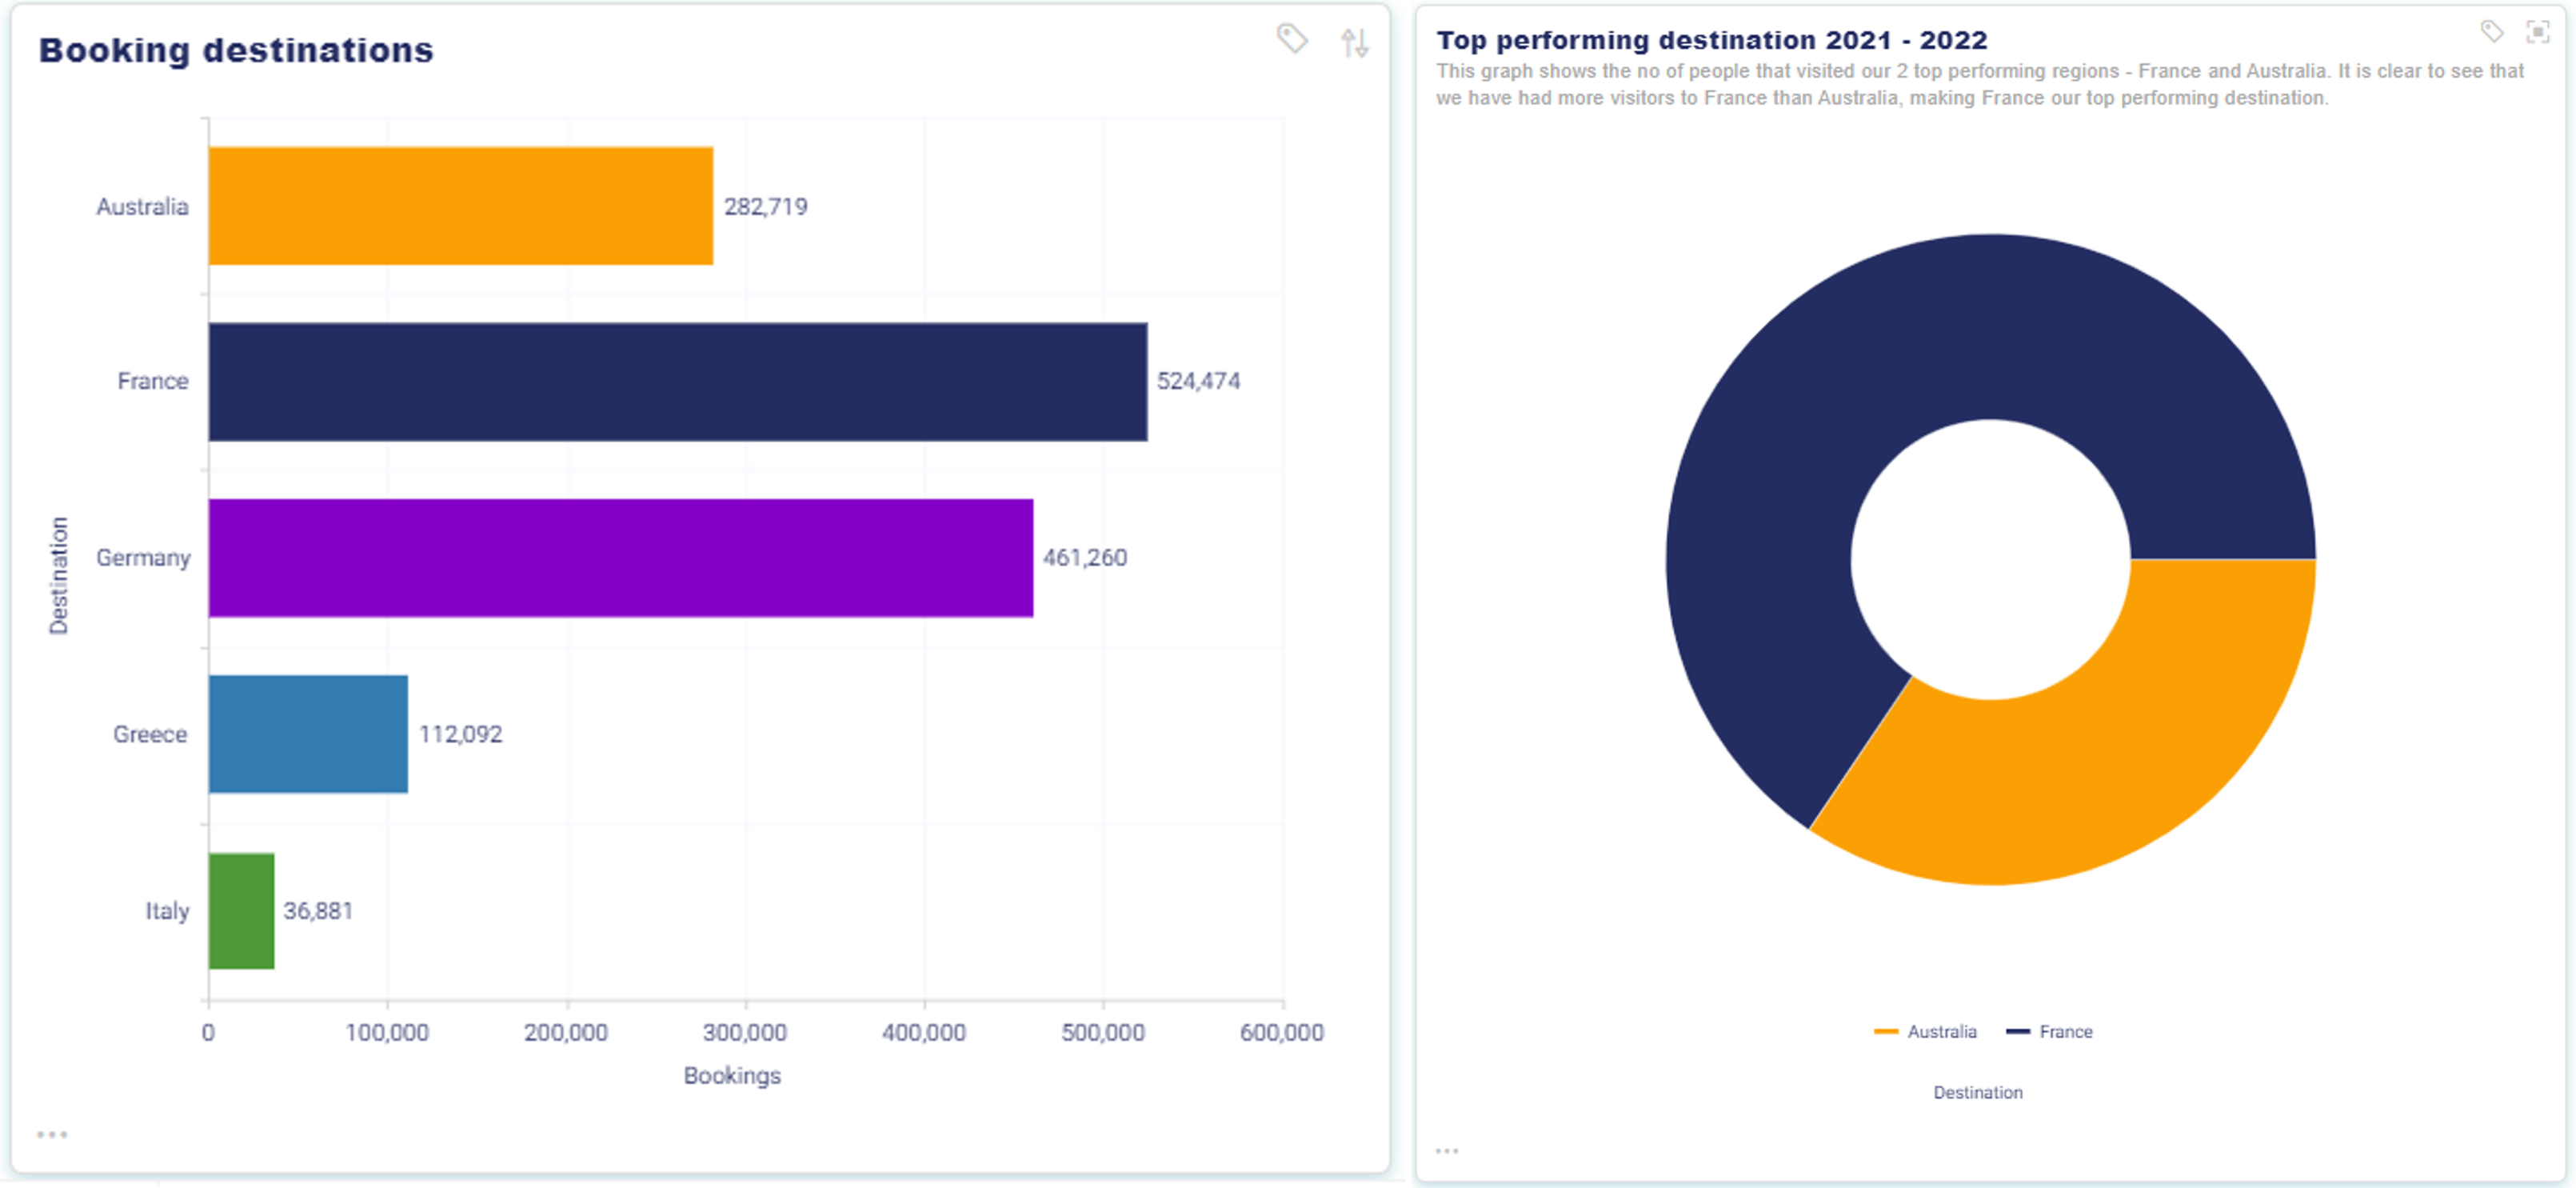
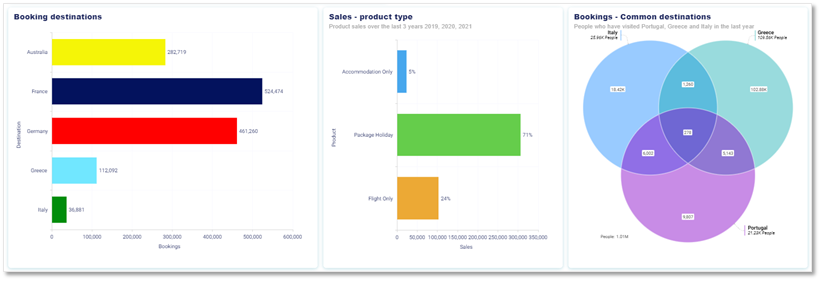
3. Use contrasting colours for comparison
Colours that are directly opposite one another on the colour wheel have the highest contrast – such as blue and orange, purple and yellow or red and green. When comparing two data sets, you can simplify data and help viewers to see the big picture by using contrasting colours.
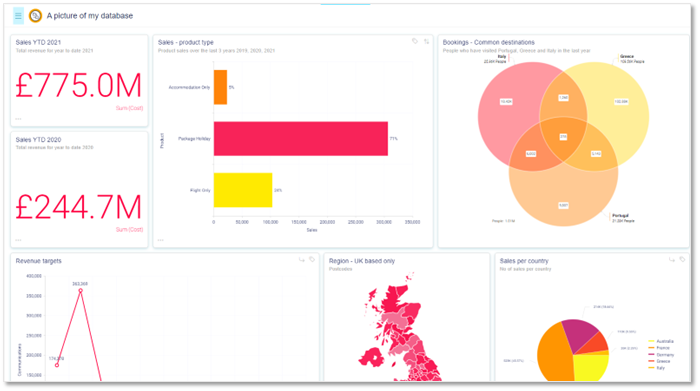
Just as a side note, red is great for attention grabbing, but can be overwhelming to the senses, so is best used in small doses.
4. Highlight key data in brights for standout
Avoid using overusing bright colours but consider giving key data a high contrast so that they are easily distinguishable. Using the same colours for everything is not only dull and uninteresting but is also confusing to viewers. You could, for example, choose to use a neutral tone like grey for less important information and use a bright colour to highlight key points.
Tip: You can set your highlight colour as part of your Apteco dashboard theme to highlight key areas you may want to add to a filter.
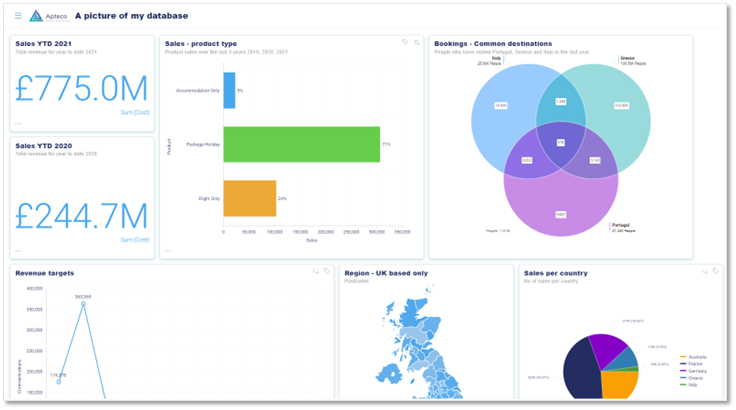
5. Too many colours can be overwhelming
You will need to choose colours based on how many variables you have, but bear in mind that the human brain struggles to process many different things at once. Consider using a limited palette to improve speed to understanding. If you use more than seven colours to represent data in a single visualisation, the brain will struggle to recall them, more than 12 and it becomes a struggle to differentiate between them.
Beware! Too many colours can be overwhelming and cause confusion…
Keeping colours consistent in terms of tonality can help to calm a busy dashboard
6. Be consistent
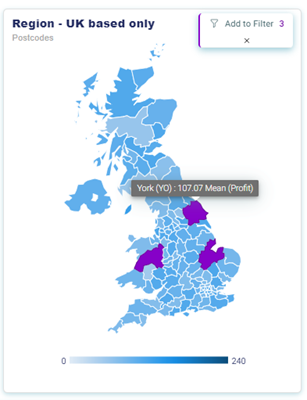
Using the same colour to always represent the same variable is a good way to ensure your audience always knows what they are looking at. For example, you may want to choose specific colours to represent certain products, or if my dashboard was looking at sales of holiday packages, I might choose a colour that will instantly represent a specific region – and then always use that colour to represent that region.
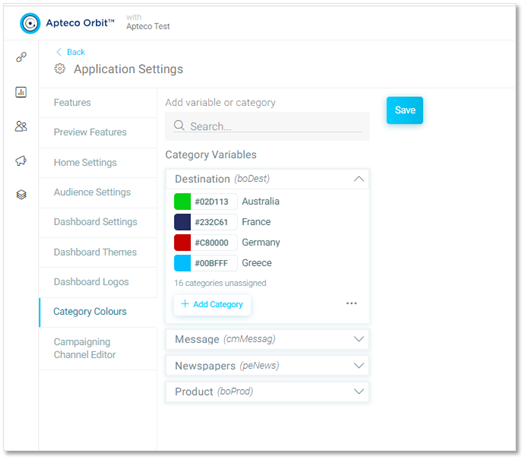
Tip: You can select and set category colours in application settings in Apteco Orbit to consistently represent certain segments in your dashboard.
7. Font colour
Using a great range of colours is no good if viewers can’t read the data. The colour of the fonts you use for your data labels and headings is important and can help with consistency and aid understanding. Make sure if you want your audience to be able to read your labels, notes and headings that you choose a clear easy to read font and colour. Perhaps use a darker colour for important information and key facts.
Tip: As part of your dashboard theme in Apteco Orbit, you can set the font type and colour to ensure legibility.
Key takeaways
- The value of using the right colours for your data visualisation should never be underestimated
- Using colour in your visualisations is more than just selecting what looks good to you
- Choose colours carefully considering the meaning behind them, taking your audience into consideration and knowing what’s appropriate for your brand
- Colours can help you to tell a more effective story, one that engages your audience at an emotional level and captures their attention quickly
- Well-chosen colours reduce the time to insight for your viewers and help them understand your message quicker
- Getting it right takes practices, so try a variety of colour combinations in your visualisations, taking a critical look each time, to assess whether you are communicating your story effectively
- If you would like to experiment a bit further on the effect colours have on your data visualisations, have a go on our free Orbit trial.
Discover how your dashboards and the message they convey change when you apply different colour themes. Click here to access our free trial >>