:format(webp))
Who really is the UK’s best athlete?
Discover how we found out who was the UK's best athlete over the past 15 years by applying various data analytics methods to real-world sports performance data.
25 years ago (7th September 1995), Jonathan Edwards produced what is arguably the UK’s best ever athletic performance in winning the World Championship gold medal in Gothenburg by leaping a mighty 18.29m, improving his own world record by 30cm (the result was 101.72% of the world record).
Athletics is a sport in which there is an interest in data analytics in terms of understanding training, recovery and performance, but there has been less written about analysing trends in athletic performance in events. British Athletics instigated the ‘Power of 10’ website to try and improve the standard of elite athletics in the country by acting as a repository for collecting event results and collating yearly rankings pages. These pages also contained two built in targets in each event to which the aim was to have 10 and 100 athletes able to better that performance bar, with the aim to drive up standards.
British Athletics has collected data since the 2006 season, so there are as of now (September 2020) 14 complete years of data, together with an as yet incomplete 15th year for the 2020 season (although this has been somewhat curtailed due to the Coronavirus pandemic).
In this blog post, we demonstrate using athletic performance data to show how analytical methods like pattern matching and expressions can be applied to real-world data. We will look at the season best performances for athletes and look for interesting insights and trends, and see if we can find the best athletic performances of the last 15 years! To create the cubes and other data visualisations within this blog, we have used our data analytics software solution Apteco FastStats.
Data Collection
The ‘Power of 10’ website has a rankings page in which you can query the data for a particular event in a particular season. For example, we can view the rankings page for the Men’s 100m in 2019 and we will see a page that starts off like this:
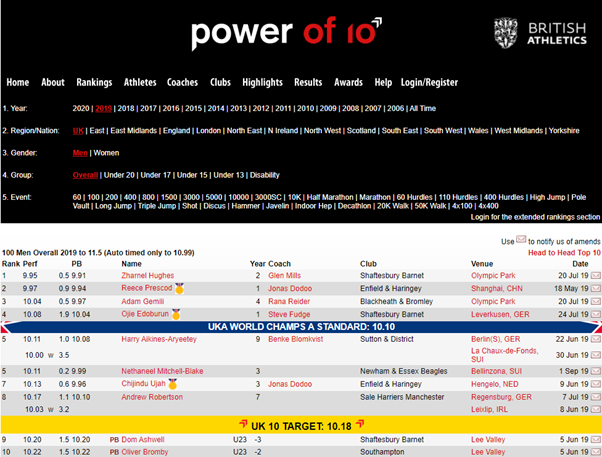
I wrote R scripts to query these pages and to obtain the relevant performance information from each page, and turn them into an R data frame. There is a lot of data to collect, and the pages differ in terms of their formats and fields (for example there are times in track events and only some have wind readings, distances in jumps, heights, points etc.) so this is not a trivial task. There is 14 years’ worth of data for 46 different events, some of which are competed in by both genders, others which are specific to men or women (e.g. 100 hurdles v 110 hurdles). This dataset comprises all the events which are on the Olympic programme and also the 10k and Half Marathon road times.
The results were initially in a simple flat format, but to aid analysis at different levels, I have used R to turn this into a 3-level structure as follows:
a) Athlete – details of the athlete (Name, Club, Gender)
b) Event – the athletic event they competed in (Event Name)
c) Performance – the actual result they had (Time or Value, Season, Date, UK Rank, Coach (1), Venue, Age Category).
For each event, the UK athletics body chooses a cut-off value, and only performances that have bettered that standard are included. Therefore, there are different numbers of athletes included for every event.
Who is the best Athlete?
One of the easiest ways to get an initial sense check on our data is to take a look at athletes with No1 ranked performances, as these will largely be by well-known athletes. There have been a total of 214 different athletes who have registered a No1 ranked performance. Clearly some athletes will have registered best results in more than one season, as well as potentially competing in multiple events. A straightforward FastStats cube data visualisation shows some of the UK’s most well-known athletes, and it is probably not a big surprise that Mo Farah comes out on top by some significant distance. He competes in a number of events and has been successful for many years.
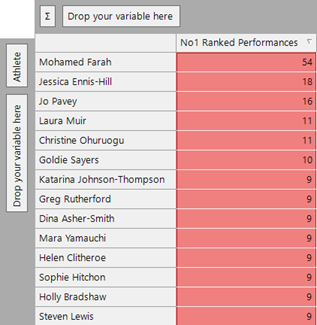
This metric on its own does not mean that he is necessarily the best athlete or has the best ever performance. There are athletes in the above results who only ever competed in a single event, so their chances of topping the rankings by this metric are limited.
Sequences of Number 1 Ranked Performances
Maybe a better way of looking for dominance of an athlete is to look for long sequences in which they recorded the top ranked performance. What is the longest such sequence for any athlete? Has any athlete been No1 in an event for all 14 years since 2006?
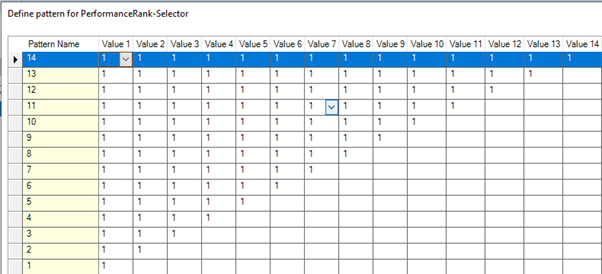
We can do this using the Pattern Matching aggregation technique in FastStats. This technique allows us to identify interesting patterns (such as repetition) in the behaviour of an individual. I turned the Performance Rank into a Selector and then looked for sequences of 1’s. We know from the data that:
• no athlete can have recorded such a sequence for more than 14 years,
• and that only one value will be recorded for each athlete in each event in each season
So we only need to look for sequences of 14 or shorter, and the patterns will be matched in downward priority which ensures that we find the longest sequence.
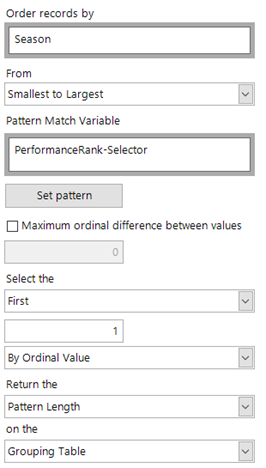
The settings below are needed to define the pattern match aggregation. The results are ordered by season and we find the longest sequence above and return the first of those (if there are multiple matches) and return the length of the pattern.
Taking 10 seasons as our initial threshold, we find only 3 athletes who have recorded 10 or more consecutive No1 ranked performances in an event:
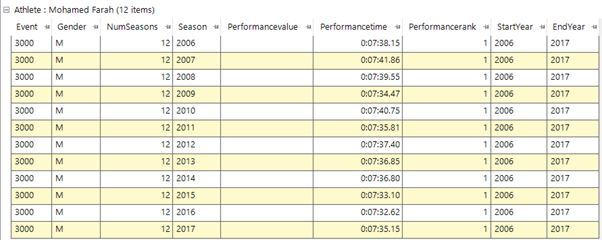
Mo Farah – Men’s 3000m (2006 to 2017) recorded 12 consecutive No1 performances. He did not record a performance in the event in 2018 or 2019.
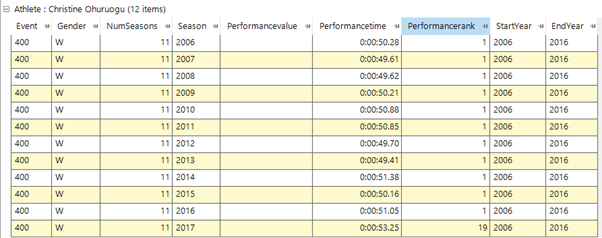
Christine Ohuruogo – Women’s 400m (2006 to 2016) had 11 consecutive No1 performances, before dropping to the 19th best performance in 2017.
Goldie Sayers – Women’s Javelin (2006-2012, 2014-2016) had 10 consecutive No1 performances, but we can see that she did not record a performance in 2013.
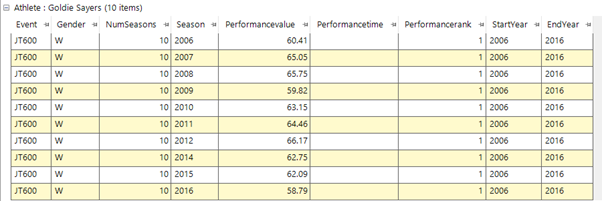
In the above analysis if we wanted to ensure that performances were recorded in consecutive seasons, then we could have ticked the ‘Maximum ordinal difference between values’. Setting this value to 1 would rule Goldie Sayers out of the above list.
None of the above athletes, however, have their longest streak of No1 performances still ongoing. We can look at ongoing streaks by selecting on those which have an ‘End Year’ of 2019. There are 19 athletes who have been top ranked in both 2018 and 2019. There are 6 athletes who are currently on a run of at least 5 years with the No1 ranked performance in their event. They are:
Holly Bradshaw – Women’s Pole Vault (2011-2019, 9 years)
Sophie Hitchon – Women’s Hammer (2011-2019, 9 years)
Laura Muir – Women’s 1500m (2014-2019, 6 years)
Dina Asher Smith – Women’s 200m (2015-2019, 5 years)
Nick Miller – Men’s Hammer (2015-2019, 5 years)
Scott Lincoln – Men’s Shotput (2015-2019, 5 years)
Sophie Hitchon, Dina Asher-Smith and Nick Miller did not record performances in 2020, but the other 3 (Holly Bradshaw, Laura Muir and Scott Lincoln) have also recorded the No1 ranked performances in the very unusual 2020 season (5) to continue their streaks – can any of them beat Mo’s 12 in a row?
What about best performances?
These measures show longevity and consistency in being the UK’s best, but they don’t necessarily show us whether the performances that they have been putting in are truly world-class or not. How can we go about measuring that?
One way of considering the merits of an individual performance (and one often used in athletic circles) is to compare it to the world record value. This appears to be a simple calculation in that all we need to do for each performance is to work out its value as a % of the world record. The complications stem from the fact that we have some events which have values recorded in time form (where all the values will be greater than the record (2)), and some which have a number form (where all the values will be lower than the record (3)).
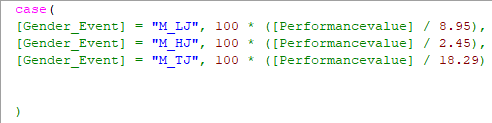
However, we can deal with this by creating an expression in FastStats and utilising a Case statement with 46 comparison clauses – one per event.
Here is an example of how this expression would start – we identify which event the performance was from, and then calculate its value as a % of the World Record in that event (8.95m is the Men’s Long Jump record etc). The screenshot below just shows three of the events!
The second decision I made was to compare each performance to the World Record that stood at the time of the performance. The reasoning here was that some events have progressed, so it was a way of making the historical comparisons fairer. However, this does lead to more complications in construction of the expressions as the value we are comparing to will now also depend upon the date of the performance in all cases where a World Record has been achieved in the last 15 years.
If we take the Men’s Decathlon as an example, the calculation looks like this:
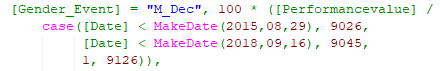
The World Record has been broken twice in the relevant time period, so before 29/08/15 we compare a score to 9026, otherwise if it is before 16/09/18 we compare it to 9045, and after then we compare it to 9126.
This leads to a lengthy involved expression, certainly the one that has taken me the most time to ever create as it needed plenty of research work since there have been more than 60 records broken in the last 15 years and I needed to go and find them all and when they happened! – but the end result is one where we will give a value to every single performance in every single event as a % of the World Record (WR) value (and necessarily these will all be <100% as no British athlete has broken a WR in the last 15 years).
We can now use a selection on Performances and select the Top N performances by the value of this metric. Here are the top 20 results:
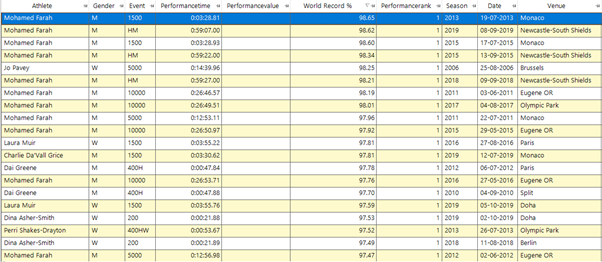
Nine of the top 10 results come from Mo Farah, with his 1500m British Record time of 3:28.81 in 2013 coming out on top of the list. The following insights can be derived in looking at this list (and by delving further into the top 200):
- 42 of the top 200 performances come from Mo Farah
- Running events make up the whole of the top 20. The best field event performance ranks 23rd and is in the Triple Jump by Phillips Idowu in 2010. In fact, only 8 of the top 200 performances come from field events (and 5 of those are from Phillips Idowu in the Triple Jump, the others are from Holly Bradshaw, Robbie Grabarz and Chris Baker)
- 68 athletes contribute to the top 200 performances, 50 of those are male and only 18 female
- Nearly half of the top 200 performances come from just 4 events (800m, 100m, 1500m and 110 Hurdles)
- There are several events with no top 200 performances at all (3000m Steeplechase, Discus, Hammer, Javelin, Shotput, Long Jump, Heptathlon, Decathlon)
- More recently, in 2020, Jake Wightman has recorded a 1500m time of 3:29.47 which would equate to a performance value of 98.34%. This would put it in 4th place on that all-time list – a very encouraging performance in the lead up to the next Olympics (4)
This calculation does not take into account the fact that there are many athletic events where the WRs have stood for 30 or more years and no athletes from any country have got close to breaking the records in those events. In some of those events these record performances have been subject to alleged use of performance enhancing drugs. Percentage based performances in these events are therefore naturally lower and it may have been a fairer comparison to find the world best performances in the last 15 years in those events, and compare to them.
Who should we watch in years to come?
One interesting exercise with this data is to try and do a bit of forward prediction and see if we can identify athletes who might be potential medal winners at the Paris 2024 Olympics and the Los Angeles 2028 Olympics.
To do this, I first looked at some of our most successful recent senior athletes who have also registered junior performances since 2006. This gives us a good idea of the level of junior performance needed that might turn into podium performances later. There are several metrics within the data that we can look at:
- the level of WR% performance in various junior age group performances
- the UK Rank of the performances in each year
- is there a clear progression of improvement throughout their junior ranks
- how old will the athlete be in the relevant Olympic year
I have chosen 3 athletes whose performances I think meet these characteristics:
a) Amy Hunt – Women’s 200m for Paris 2024
Her performances have improved in each of the age groups, and her U20 performance is a relatively better performance than the 2019 World Champion, Dina Asher-Smith.
U13 - Rank 555 26.40 WR% 80.83
U15 - Rank 140 25.20 WR% 84.68
U17 - Rank 43 24.33 WR% 87.71
U20 - Rank 2 22.42 WR% 95.18 (in 2019)
b) Max Burgin – Men’s 800m for Paris 2024
His performances have shown a marked improvement over the age groups in an event where we have an excellent depth of performances and continues to improve into 2020 where he has recorded a UK record time for the U20 age group.
U15 - Rank 1057 2:02.44 WR% 82.42
U17 - Rank 12 1:47.36 WR% 93.99
U20 - Rank 6 1:44.75 WR% 96.33 (in 2020)
c) Nia Wedderburn-Goodison – Women’s 100m for Los Angeles 2028
It is a much harder job to predict for an event in 8 years’ time, but here is my pick. Her U15 and U17 times are in line with Dina Asher-Smith’s, they are the best WR% performances in these age groups in recent years and are showing promising progressions across the age groups.
U13 - Rank 417 12.69 WR% 82.66
U15 - Rank 40 11.84 WR% 88.60
U17 - Rank 5 11.71 WR% 89.58 (in 2020)
Conclusion
This post has shown how a range of data analysis techniques can be brought to bear on athletic performances, and how expressions can be used to compare performances over very different events to work out who really has been the UK’s best athlete of the last 15 years, and who may become the UK’s best athletes in the years to come! Identifying patterns in behavioural data like this is also a commonly used technique in marketing. The knowledge of patterns in individual buying behaviour is a powerful tool and can for example be used to identify your best next customer for a certain product or even to predict event-triggers for your campaigns.
If you would like to learn more about data analysis techniques and how they can be combined with technology to create new insights from your data, download our free eGuide.

Notes
(1) – An athlete’s club and coach could change over time, but the data has been structured in such a way to record the Club as a one-off attribute of the athlete, so it wouldn’t be possible to historically look at Club rank performance as we can’t guarantee that the athlete belonged to that club when that performance happened. Conversely, the Coach is tagged to a performance so you can see athletes who changed coach as time went on. This would enable for instance to see which are the coaches responsible for high ranking performances in each event.
(2) – No UK track athlete has broken an Olympic event world record in the last 15 years so all the times will necessarily be larger than the record, and the calculation will be 100 * <record value> / <performance value>.
(3) – All non-time based events have been recorded as a numeric value, as it does not matter whether they are distances, heights or points totals. No UK field athlete has broken an Olympic event world record in the last 15 years so all the values will necessarily be smaller than the record, and the calculation will be 100 * <performance value> / <record value>
(4) – Note that this is just one performance from 2020; there may be other relative better ones as the 2020 data has not been collected for this analysis.
(5) – This blog was written during 2020, but with final editing in 2021, so a look at the Rankings so far this year shows the same 3 athletes also top of the pile so far in their events in 2021.