The Apteco Datathon: 5. Significance of East Anglian football
19 Dec 2018 | by Chris Roe
In the latest blog in our Apteco Datathon series, we analyse the results of English football games to reveal fascinating trends. While most of us know who won the league last year, what about a combined league from the past 20 years? Or the most movement between leagues? FastStats gives us the answers.
In this blog post we’ll return back to the football dataset from an earlier blog post (1). In that post we undertook some analysis on international football matches. Our dataset has information on matches from a number of the European leagues, but in this post we’re going to look at some English league matches. We have data from matches since 1888 to the end of the 2017/18 season for the top four divisions of the English leagues.
In this blog, we’re going to take a look at some things that you’ll probably be able to find out quite easily, and hopefully some that aren’t so simple to find out! To give you the chance to test your footballing knowledge as you read the post, I’ll pose some questions as we go along – but don’t worry, the answers do follow!
League Tables
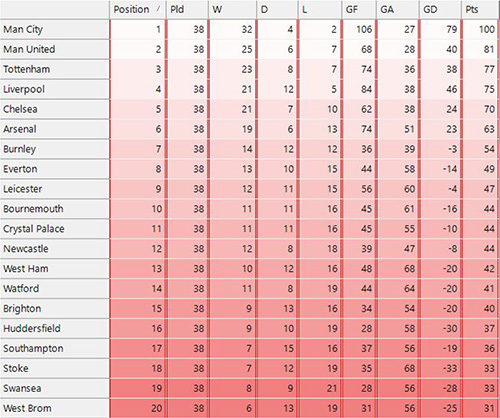
Let’s start off with something nice and simple which is a good check for data accuracy. Can we replicate the 2017/18 Premier League table in a FastStats cube?
Well – here’s the result, a pretty close resemblance to the league table that you’d find from the 2017/18 season (2).
Now, let’s look at how we’ve created this cube. It has an underlying selection, one dimension and nine statistics (including one count statistic, three query statistics, two variable statistics, one expression statistic and two calculated statistics).
The data contains information on multiple leagues over many years, so our underlying selection will restrict the matches to just the English matches from the top division from last season. Adding team name as a dimension and a simple Count statistic gives us the 38 matches played by each team in a season (we’ve renamed the statistic to ‘Pld’ above).
The next step is to add the (W,D,L) statistics. These are all simply queries. They’re simply a selection of ‘Team result = Win’ (etc) which is then added to the cube.
Now we add the (GF (goals for), GA (goals against)) statistics. These are Sum() variable statistics where the variable is goals scored by the team and their opposition respectively.
The (GD (goal difference) statistics) is simply a calculated measure of GF – GA.
The Points statistic is a Sum(expression) where the expression is simply “If the result was a win, three points, if draw then one point”. No points are awarded for a loss so we can safely ignore that case. (5)
Finally, the ‘Position’ Column is a Rank() statistic calculated by simply ordering the number of points column to give the overall position for each of the teams.
We could have repeated this technique with any of the European leagues, or for any of the supported divisions for any of the seasons we have results for. Furthermore, we could have set this up as a parameterised selection that asked the user for the league, division and season before creating the table. This could also have been presented in the form of an interactive Excelsior report as well.
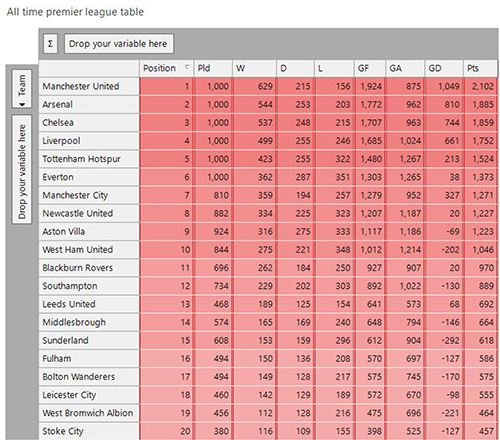
This technique could also be used to do multi-season league tables. The example below shows the top teams when the results of all the seasons since the Premier League started are taken into account.
Let’s move things up a notch and pull together a consolidated league table for the top four English divisions and place each of the teams from 1-92. By then adding season as a dimension we can then track the finishing positions of teams over multiple seasons.
I’ve altered the points calculations so that teams in higher divisions get much higher points so that the 20 teams in the top division will occupy positions 1-20, then the next division 21-44, 45-68 and then finally 69-92. A team that dropped out of the top four divisions in a given season would be represented by position 93 as they would have scored 0 points in that season. Note here that the season variable values refer to the start year of the season.
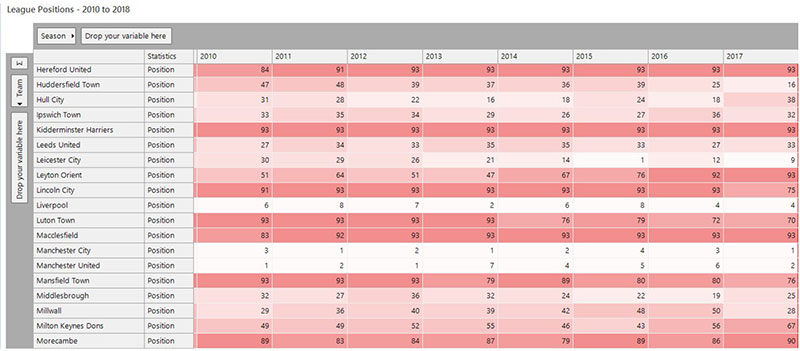
The above cube shows a subset of the league teams, but shows plenty of interesting teams:
- Leicester City’s remarkable season in 2015 stands out.
- There are generally improving teams like Huddersfield and Luton.
- There are very successful teams like Manchester City and Manchester United.
- There are generally weakening teams like Leyton Orient and Milton Keynes Dons.
- There are very stable teams in lower leagues, like Ipswich City and Leeds United.
- There are teams like Hull City that have yo-yoed between divisions.
An extension of the above analysis allows us to compare teams over time. Which teams have improved or maintained their finishing positions over the last few seasons? Many teams can boast four consecutive years of this, but both Plymouth and Preston North End have had six seasons. Can they keep that going this year? (3)
League positions over time
Using comparison measures on the cube above we can compute the differences to the league position achieved a few years ago. The measure below shows the positional improvements compared to five years ago and has been sorted by best total improvement. We find that Plymouth, Bournemouth, Preston North End, and Burton Albion are the most improved teams.
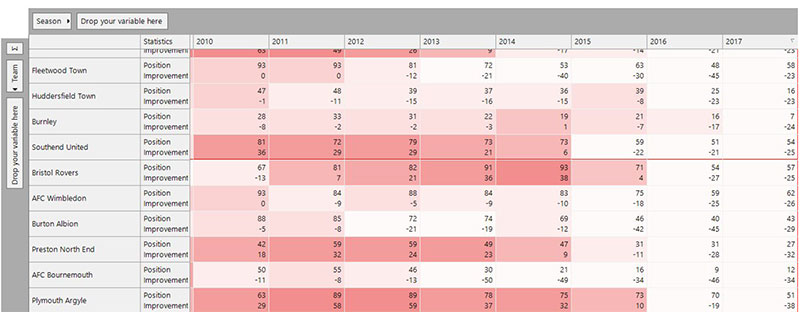
If we looked at the other end, we’d find that supporters of Leyton Orient, Yeovil, and Tranmere Rovers certainly haven’t been in it for the glory recently!
Team stability in a league
Many football fans would be able to tell you about the teams that have remained in the top division of English football for the longest consecutive amount of time (Arsenal and Everton are the top two). It’s to be expected that the top division will have teams that have remained there for a long time since very strong teams just have to avoid being relegated. Teams that stay in one of the lower divisions for a long period of time are less likely, since they only have to have a good or bad season to be promoted or relegated. So, which team has remained in the second, third or fourth tier of English football for the longest? (Hint – it’s 16 years and the answer is coming up!)
We can answer this question using the Segmentation tool. This is a similar approach to the one we used in the World Cup blog post. In this case, we can use our domain knowledge of the football league fixture schedule to set the segment definitions to follow this pattern:
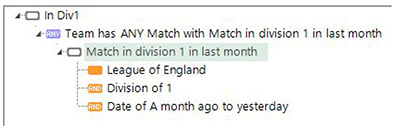
We know that a team will only ever be in one division each season, so as long as we set the reporting points of the segmentation to be during the season then that team is in that segment at that point in time (4).
We can now use the retention tool to look at how long each team has been in any division from any given season. We only need to check which segment a team is in once a year as they cannot change more regularly than that. By setting our bands to one yearly, we can then break the teams down into exactly how many years they have been in the division for. This gives us some expected results – the first column here (3, 6, 7, 6) shows the teams that were promoted/relegated into that division for this season.
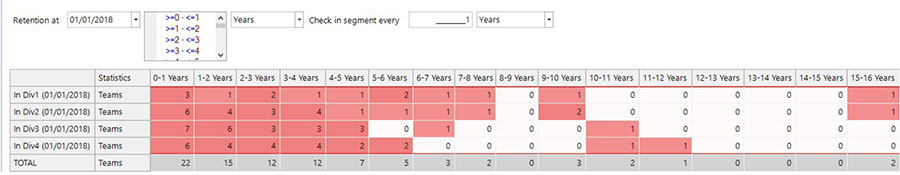
If we look at the team that was in division 2 (Championship) for 16 years we find the team that has remained in the same non-top division for the longest period of time is Ipswich (6). The teams in division 3 and 4 who have been there for 11 and 12 years respectively are Walsall and Accrington.
Here’s one final piece of segmentation related analysis. Which football club has changed divisions the most times in the last 10 years? And how many times?
We can use the Segmentation Journeys tool to answer this question. By setting the start and end points of the journey to be 01/01/2009 and 01/01/2018 and with eight intermediate points we can look at the divisions a team has been in during the last 10 years (here A,B,C,D represent the divisions 1-4 respectively).
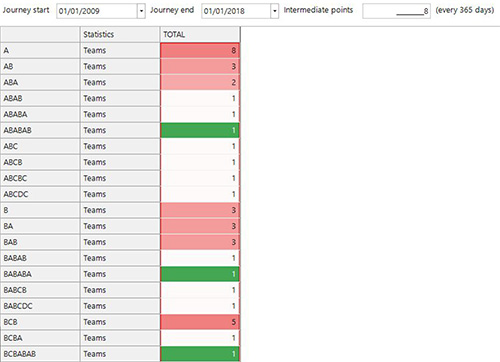
Although I’ve only shown a snapshot of all the possible journeys here, the three highlighted are the teams who’ve played in the most divisions in the last 10 years. They are Hull City, Burnley, and Norwich respectively. The team that has jumped divisions the most in that period of time is Norwich City (7).
Conclusions
Hopefully reading this blog has given you some new understanding of football statistics, and also shown you some of the techniques within FastStats that we can use to address those questions. If it has given you the ability to stump your friends and colleagues with football-related trivia, then even better!
References
(1) See football world cup blog post at https://www.apteco.com/blog/apteco-datathon-2-can-tunisia-win-world-cup.
(2) See https://en.wikipedia.org/wiki/2017–18_Premier_League. The positions in the FastStats cube here don’t quite match up to the league table where the points totals between adjacent teams are the same. They should be ordered on goal difference as well as points. We could have done this in this cube, but I use the correct ordering technique in the subsequent analysis.
(3) At the time of writing (28/11/18) this seems unlikely. Plymouth are currently in 22nd place in League One (66th overall), so have to improve another 15 positions to keep their continual improvement going. Preston North End are in 15th place in the Championship (35th overall) so have to improve another 8 positions to keep their continual improvement going.
(4) Note that time reports make no sense as there will always be the same number of teams in each division. Likewise, the migration reports will show the same number of teams (those being promoted and relegated will stand out), but at least dragging those off gives us the chance to identify those teams, and for pursuing questions like ‘which teams get promoted/relegated the most?’
(5) Note that 3 points have been awarded for a win since 1981. Previously 2 points were awarded for a win. In the analysis here we have only been looking at recent matches, but if we wanted to look at older matches we would need to change this statistic to reflect this.
(6) This is an instance of the famous commentator’s curse! Ipswich are firmly rooted to the bottom of the Championship table (28/11/18) so they have some work to do to keep this record going!
(7) Norwich are currently in a promotion position, so this behaviour may well continue this season.