:format(webp))
Points in time: Tracking the rise and fall of penalty points
Apteco software is most often used to analyse customer, prospect and supporter data, helping organisations improve their marketing communications and fundraising activities. Every so often, however, we enjoy applying our analytical capabilities to external data sets, exploring wider trends and bringing fresh insight to topics beyond our day‑to‑day use cases. In this instance, we’re revisiting a familiar topic with an updated dataset to see how the picture has changed and what new insights the latest data reveals.
In our previous blog ‘Who’s behind the wheel? Driving licence trends and penalty points across the UK’ we looked at a single snapshot of data released by the DVLA in February 2025 containing driving licence holders and penalty points broken down by age, gender and location. We used this data to investigate the relationships between penalty points and demographics. The main findings were that:
- At all ages, there are slightly more male licence holders than females
- As a percentage of drivers, males have at least twice as high a percentage of penalty points compared to Females, with the ratio becoming higher as the age goes down from 25 to 17
- Geographically, licence holders in the South West and areas in Yorkshire on average have a higher percentage of penalty point holders than many other areas of the country
This new updated blog takes a closer look at how those relationships have shifted over time, but this time using DVLA data snapshots up to August 2025, spanning a 13-year period to uncover the trends beneath the surface. Apteco’s AI assistant, Orin has been used to generate some of the analysis and summaries (shown in italics).
The data and its limitations
The DVLA has released 38 versions of this dataset between November 2012 and August 2025 (see Appendix for detail). It’s also worth noting that holding a driving licence doesn’t tell us how often - or how far - someone actually drives, so we can’t link things like penalty points to miles driven. Some licence holders may not drive at all, whether due to not owning a car, illness, or even death. If we assume this proportion stays fairly stable over time, comparisons across years are still valid. The key implication is that, in reality, the share of licence holders with points is likely slightly higher than reported.
Licence holders are on the rise (but that’s not the whole picture)
Over the years, the number of licence holders has been on a steady climb - pretty much every snapshot shows growth, except for the Covid period between June 2020 and March 2021 (no surprises there). In total, we’ve gone from 37.5 million to 42.7 million licence holders over the past 13 years.
When it comes to the male vs female split, not much has changed. Men still represent a slight majority, although their share has edged down slightly from 54.60% to 53.46%.
One thing worth keeping in mind: this data doesn’t tell us how many people are actually out there driving. It simply counts who has a licence - not who’s out there actively driving, or how often. So, while more people are licensed, it doesn’t necessarily mean the roads are getting busier.
Young drivers behind the wheel
Recent shifts in licence numbers have been largely fuelled by younger drivers. For those aged 17 to 21, the number of full licence holders has bounced around quite a bit since 2012, with a noticeable dip during the pandemic.
That drop isn’t too mysterious - driving tests were put on hold for four months in 2020 (March to July) and again for another four months in 2021 (January to April). With no tests happening, fewer young people could get their licences. And because younger drivers make up the bulk of test takers, they felt the impact more than anyone else. The chart below brings this trend into sharper focus.
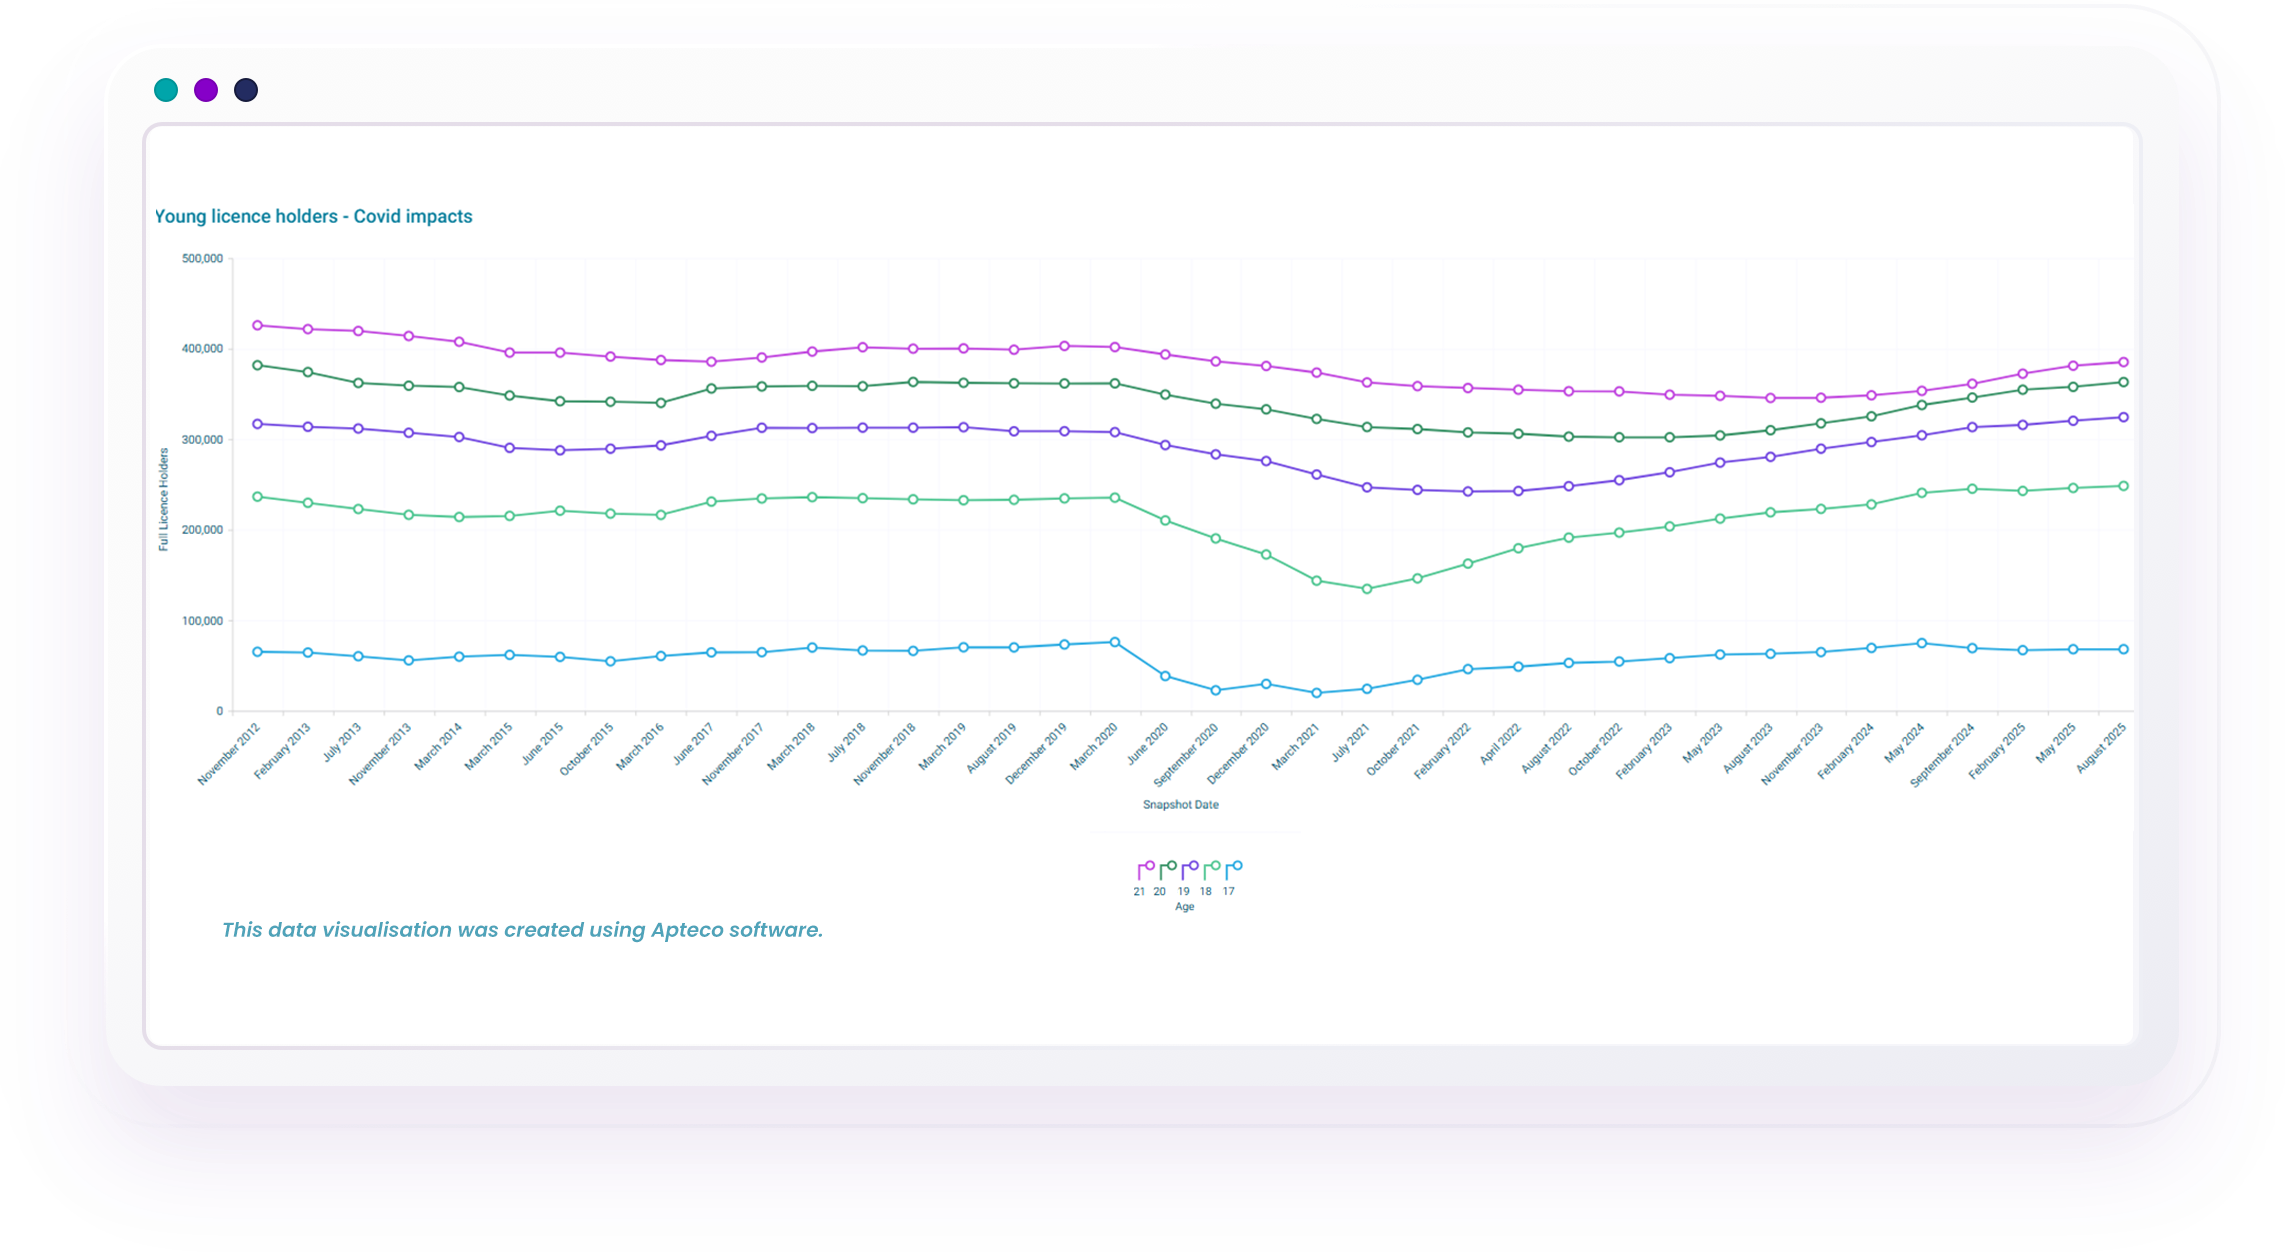
The total number of full licence drivers under 22 years has fluctuated significantly from November 2012 to August 2025, with notable declines during the pandemic. The youngest age group (17 to <18 years) saw a dramatic drop from 76,097 in March 2020 to 22,843 in September 2020, indicating a severe impact of Covid-19 on new drivers. Recovery trends post-pandemic show a gradual increase in driver counts, particularly in the 18 to <19 and 19 to <20 age groups, suggesting a rebound in new drivers. The most recent data from August 2025 indicates a return to pre-pandemic levels for the 17 to <18 age group, with 68,223 drivers.
Who’s picking up points? A closer look by age and gender
The second part of the data zooms in on drivers with penalty points, breaking things down by age, gender, and region. Male and female figures are shown separately, with the charts highlighting the percentage of drivers in each age group who have points on their licence.
The earliest snapshots show the highest proportions of drivers with points up to age 50. From 2017 through to 2021, there’s a general downward trend, hitting a low in October 2021. This again is potentially due to Covid restrictions (less driving, fewer offences), but without more detailed data, that’s just an educated guess.
By 2023, the numbers start to creep back up - likely reflecting a return to more typical driving patterns. But it’s the August 2025 data that really stands out. While the pattern looks familiar up to the early 30's, the percentage of drivers with points climbs noticeably into the mid-50's. Among older drivers, this snapshot records the highest levels overall, though the data doesn’t tell us exactly why.
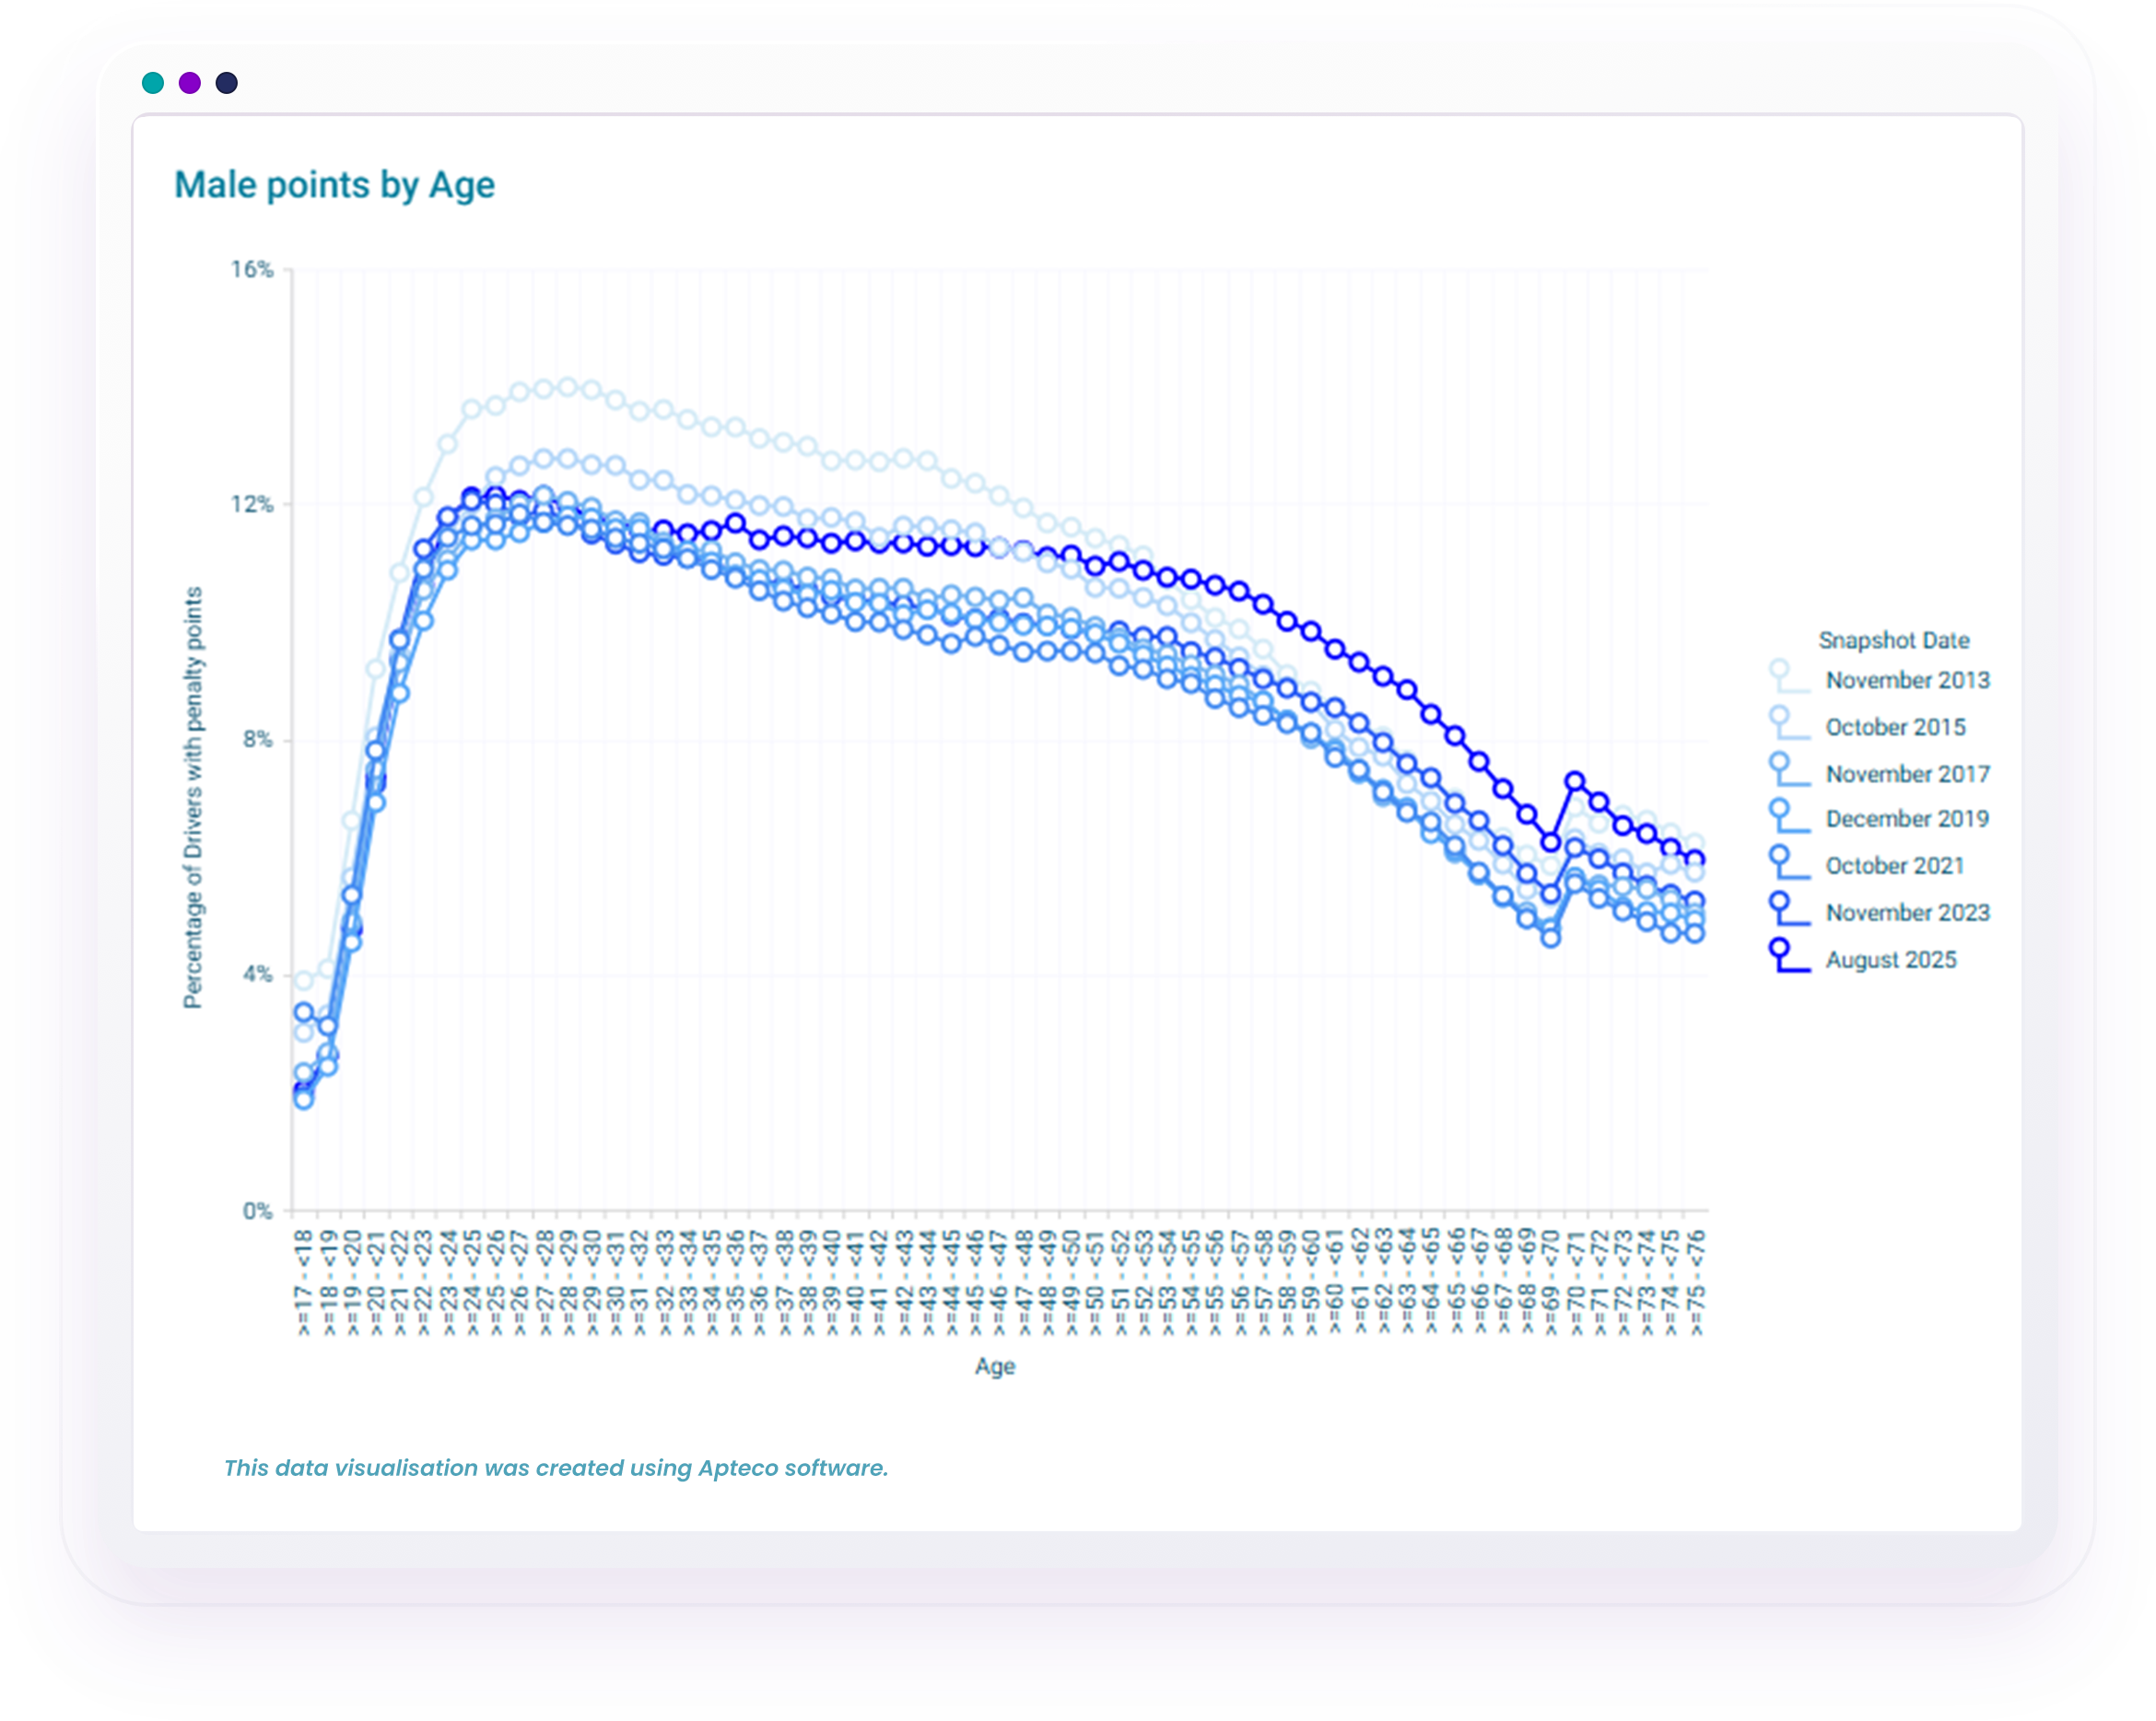
One trend that stays consistent throughout: drivers in their early to mid-20's are the most likely to have penalty points. After that, it’s a steady decline with age – with the exception of a spike at 70. That jump is less about risky driving and more about the way the data works, as licence renewals at that age tend to filter out people who are no longer driving.
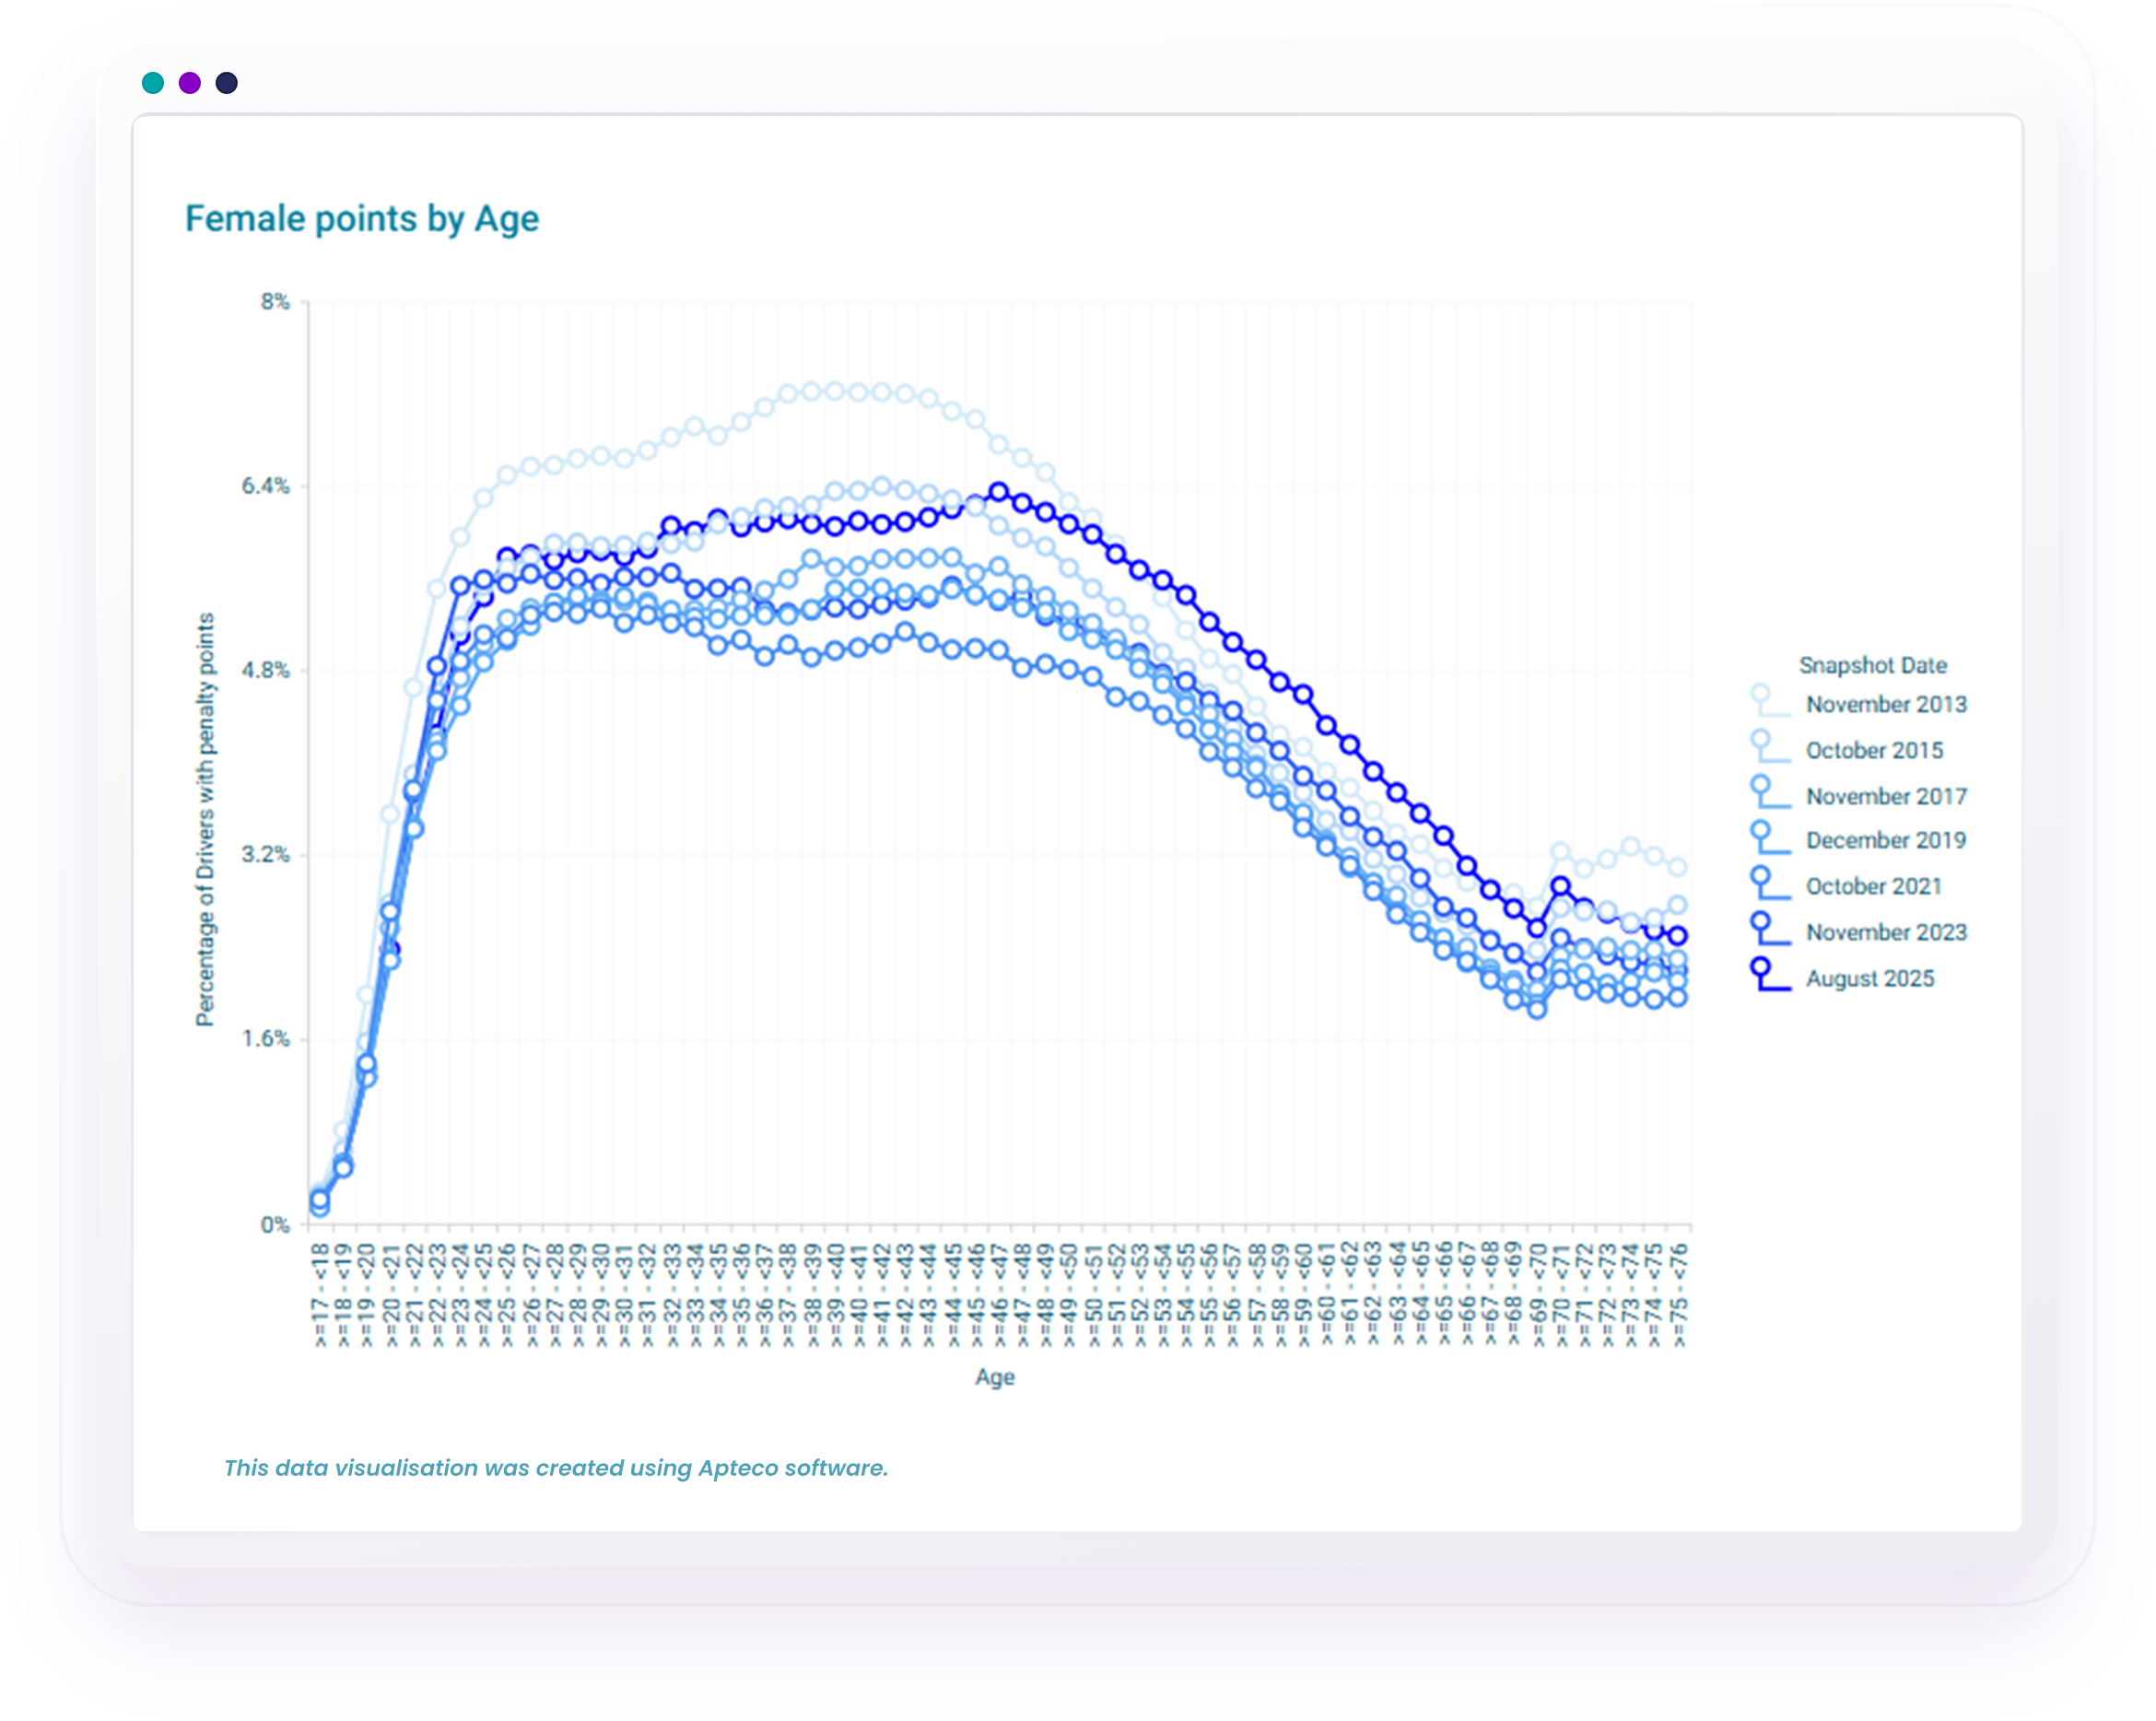
The female chart mirrors the male trends in several ways. The earliest snapshot from November 2013 shows noticeably higher percentages for drivers under 50, while the post-Covid 2021 data sits at the lowest point.
Similar to men, drivers in their mid-50's and older hit the highest percentages in the most recent snapshot.
Where the female data diverges is in which age group tops the chart. Over the years, the peak has shifted: the most recent snapshot shows age 46 leading, the previous one was 32, the post-Covid period was 29, and earlier snapshots generally hovered in the late 30's. This highlights how the age profile of female drivers with points has changed over time.
In general, we can conclude female drivers exhibit consistently lower penalty points percentages across all ages compared to males, with a general upward trend in recent years.
In our previous blog we highlighted:
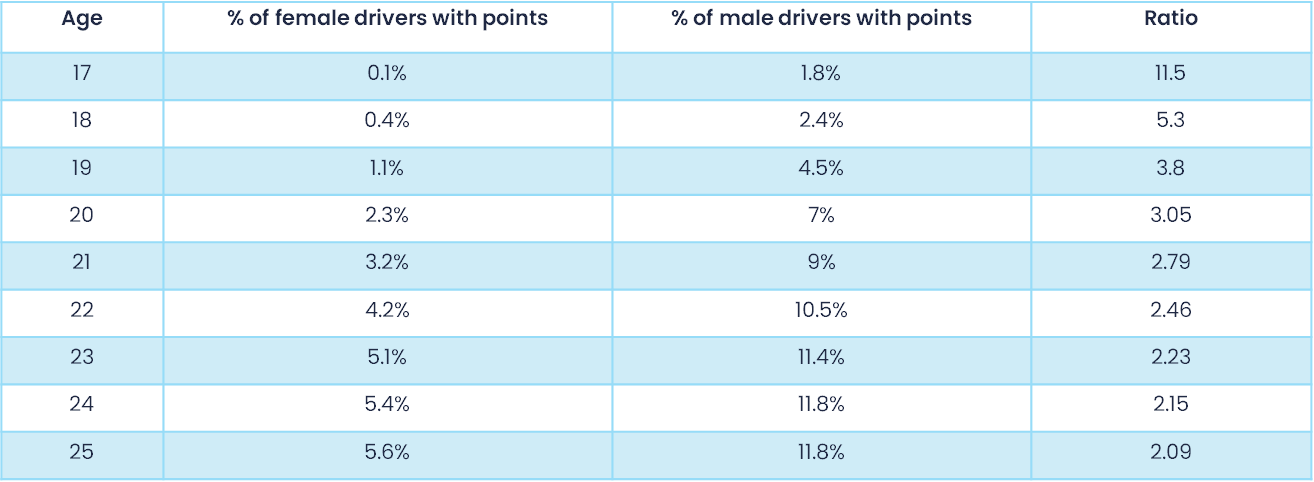
For drivers aged 25 and over, men with penalty points outnumber women by about two to one. That gap widens among younger drivers, peaking at roughly 10 times higher for 17-year-olds, as the table below from that post illustrates.
These ratios broadly hold true across each of the earlier snapshots.
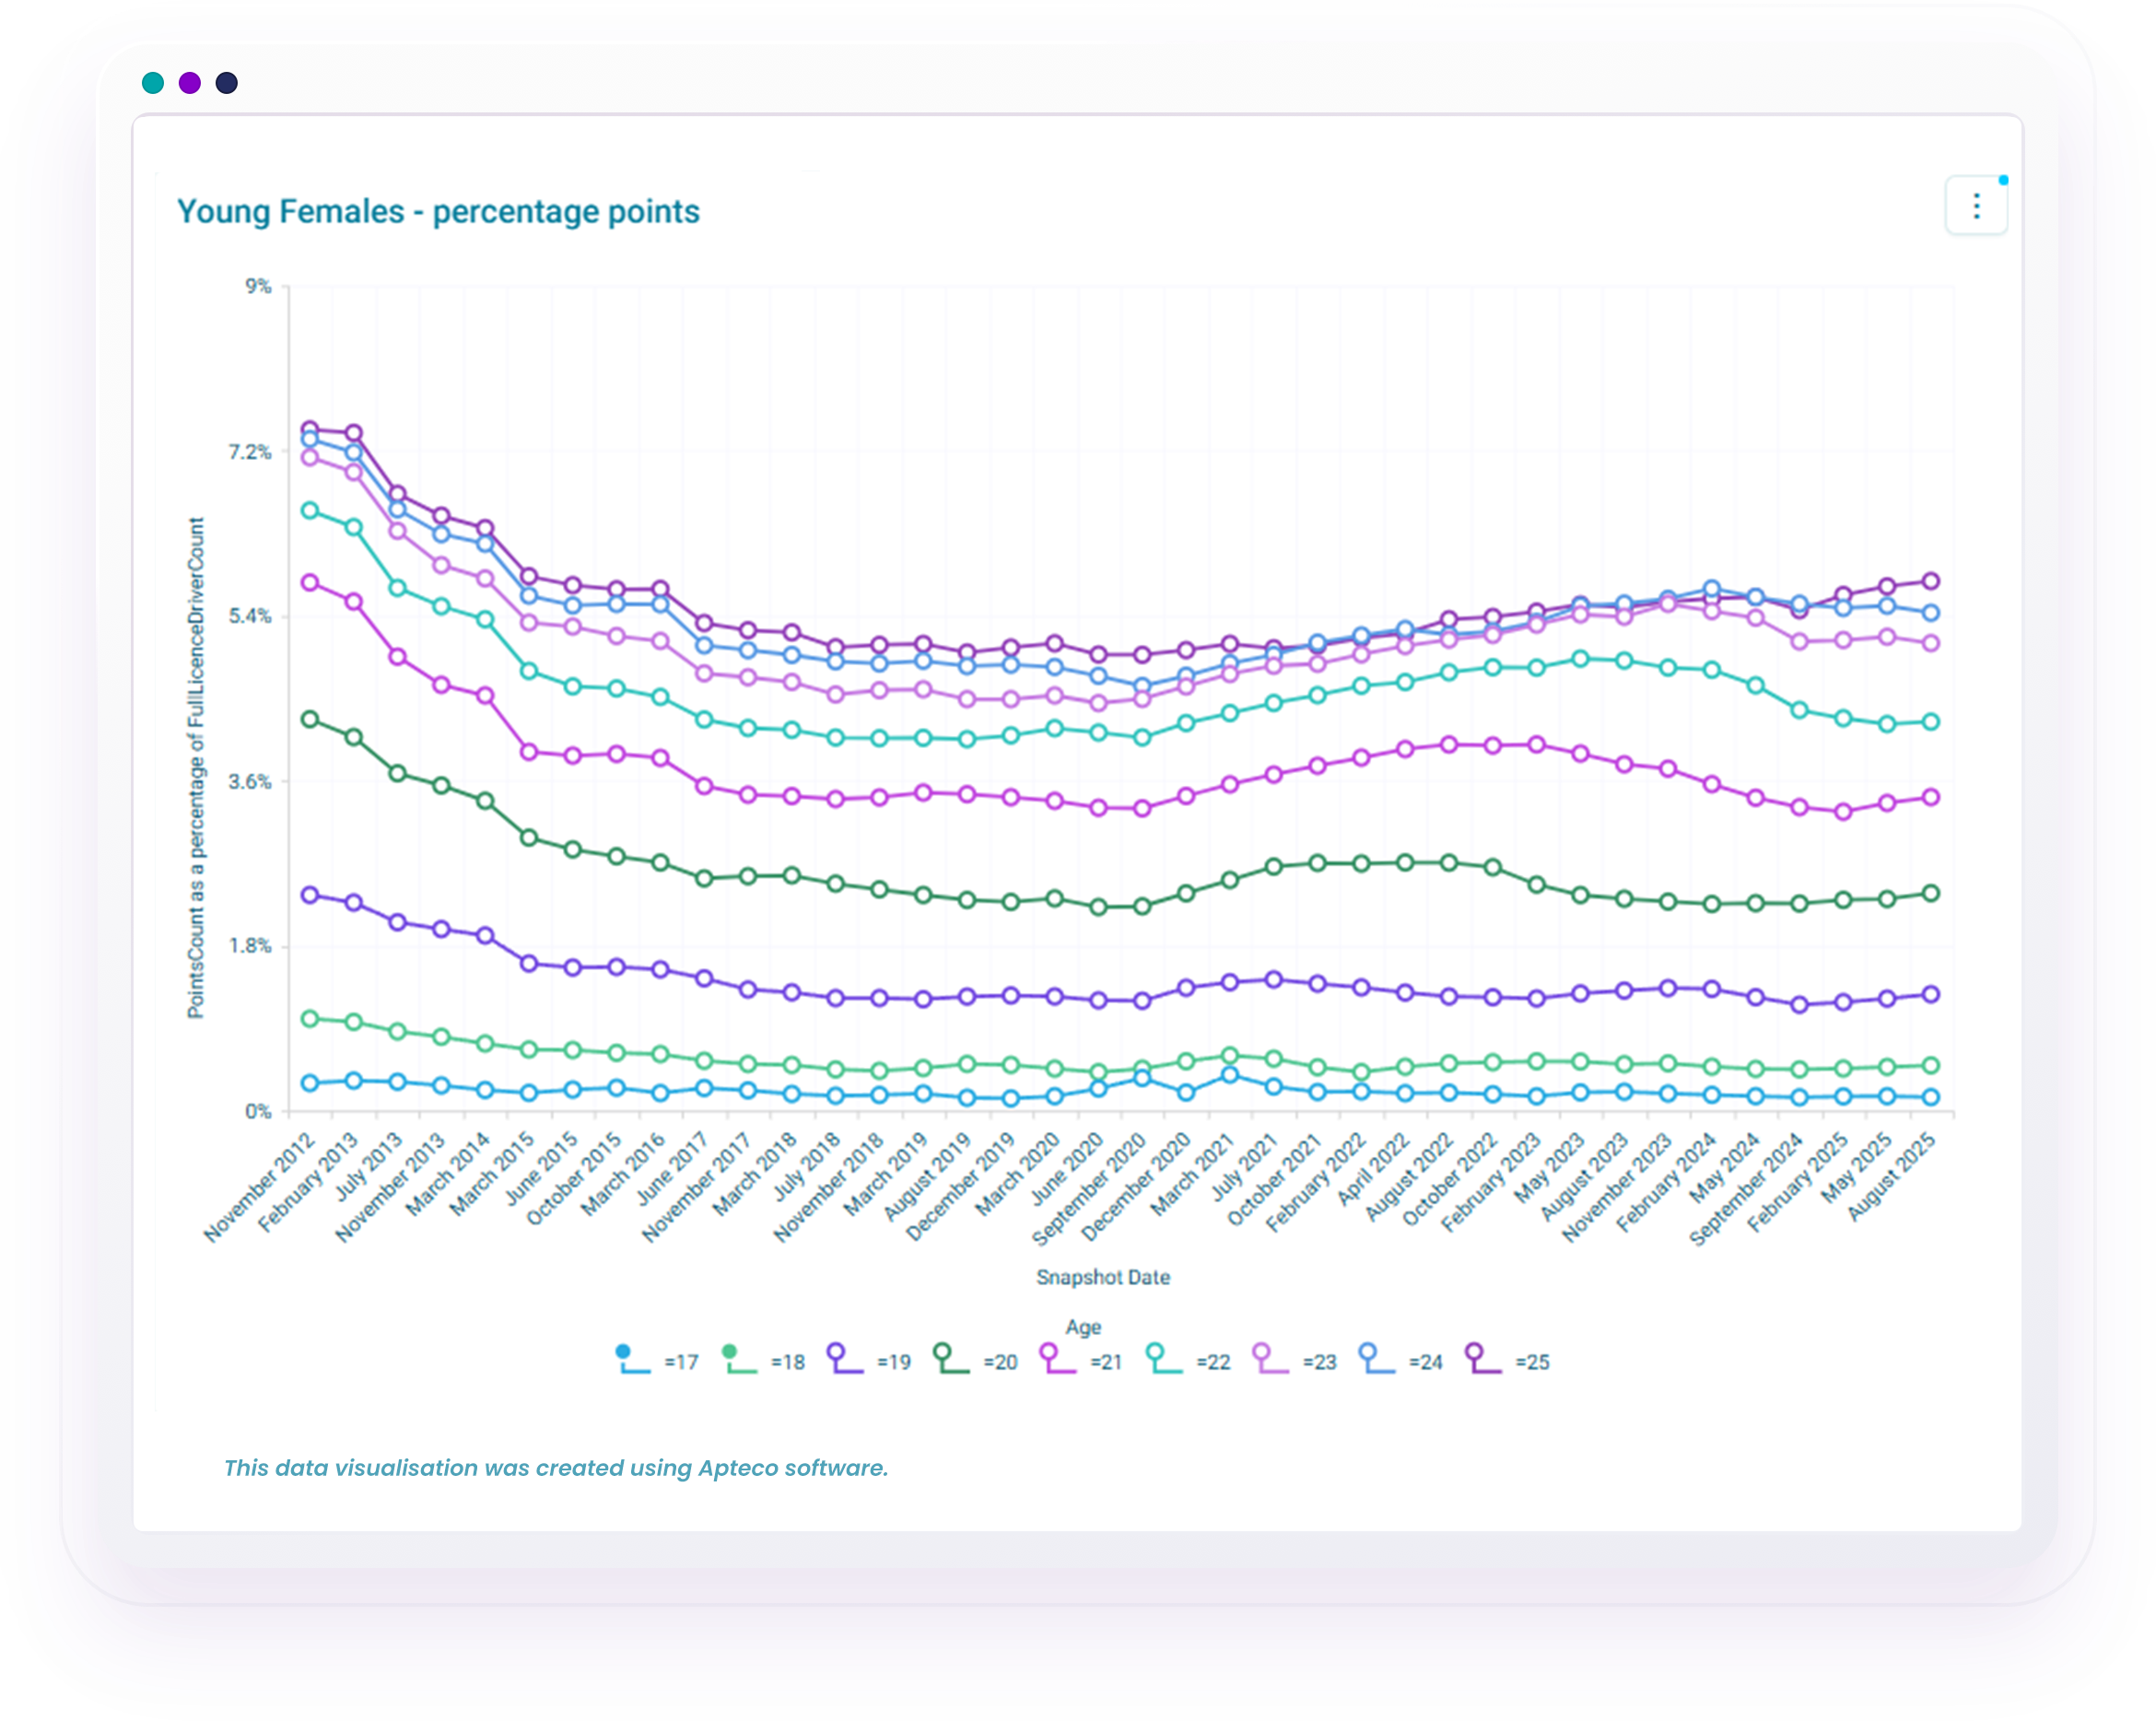
The two charts below display the percentage of drivers with penalty points by gender for those up to age 25. In general, the proportion of drivers with points tends to rise with age, reflecting the fact that points stay on a licence for several years.
Young males consistently show higher PointsCount percentages compared to young females across all age groups and time periods. The gap between young males and females has remained significant, indicating persistent behavioural differences in driving patterns or risk-taking. Both genders exhibit a general downward trend in PointsCount percentages over time, suggesting improvements in driving behaviour or changes in licensing policies.
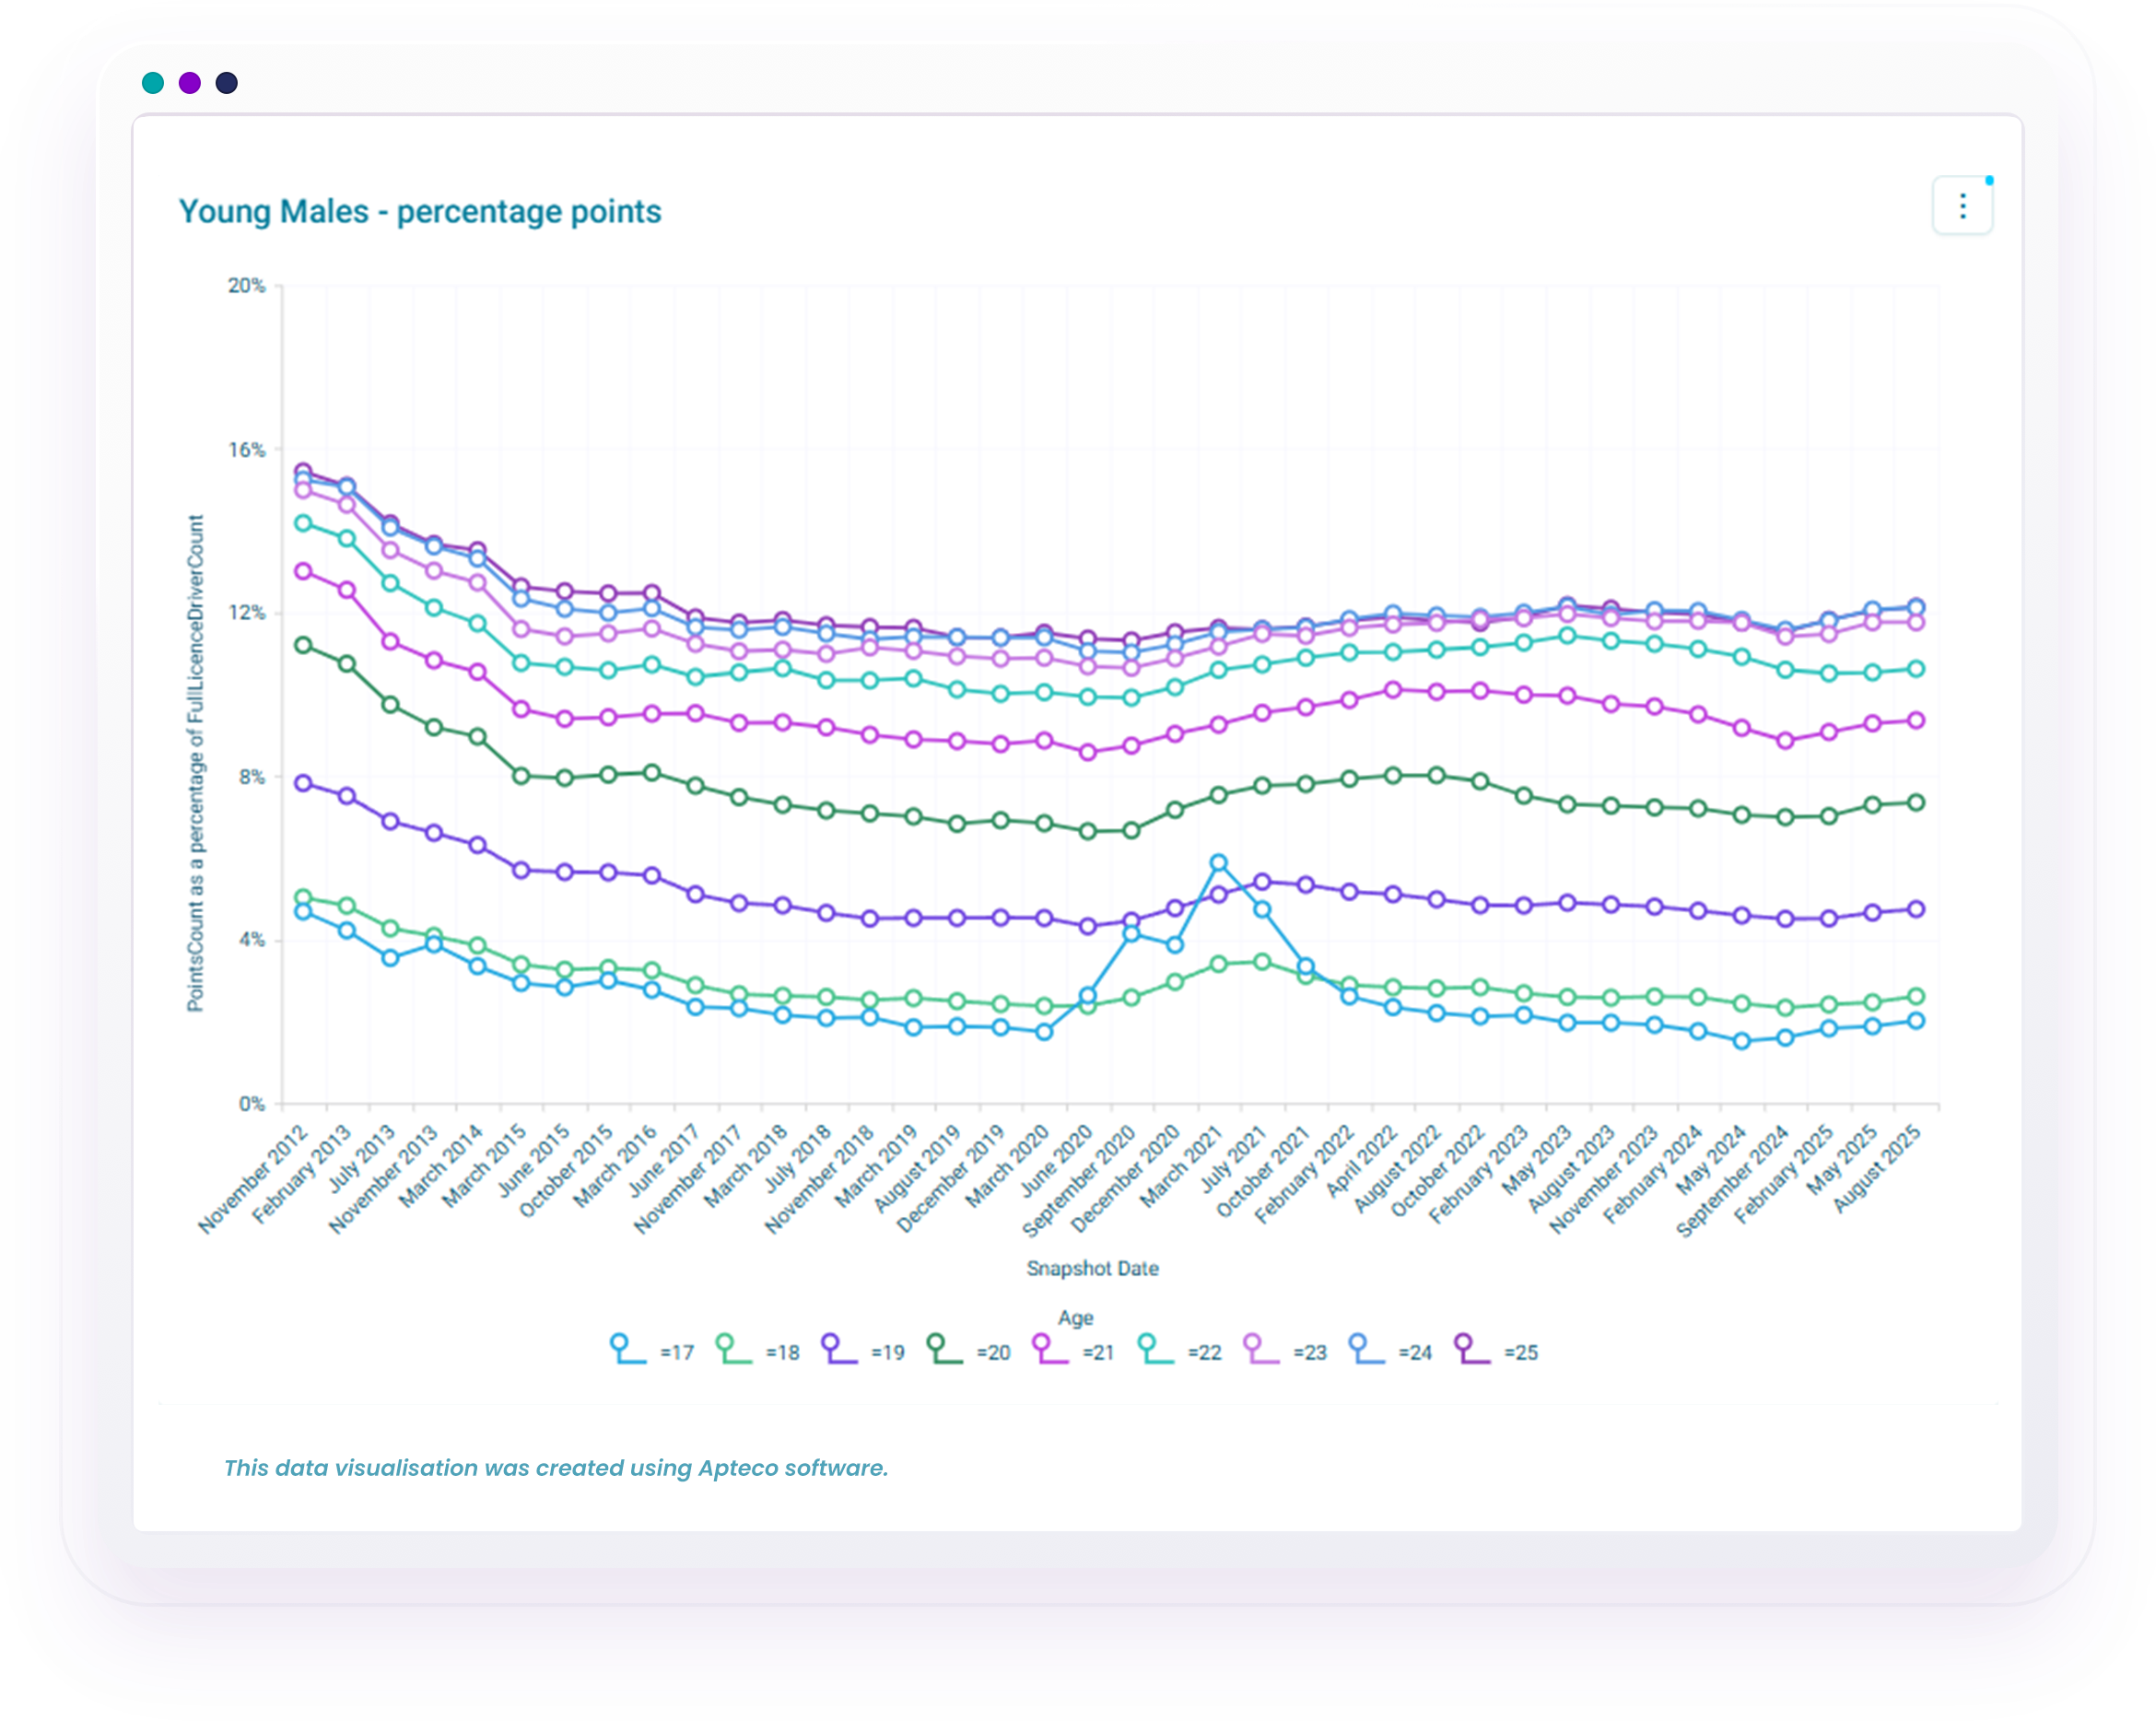
The standout feature of the male chart is the Covid period, where the percentage of 17-year-old males with penalty points jumps from around 2% to roughly 6%, before settling back in line with the general trend over the following year or two. For females, there were minor increases at certain ages during Covid, but nothing nearly as dramatic as what we see for males.
Mapping penalty points across the UK
In our previous blog, we focused on the February 2025 snapshot, looking at the percentage of drivers with penalty points by postal area. The highest percentages at the time, were in Yorkshire and South West England.
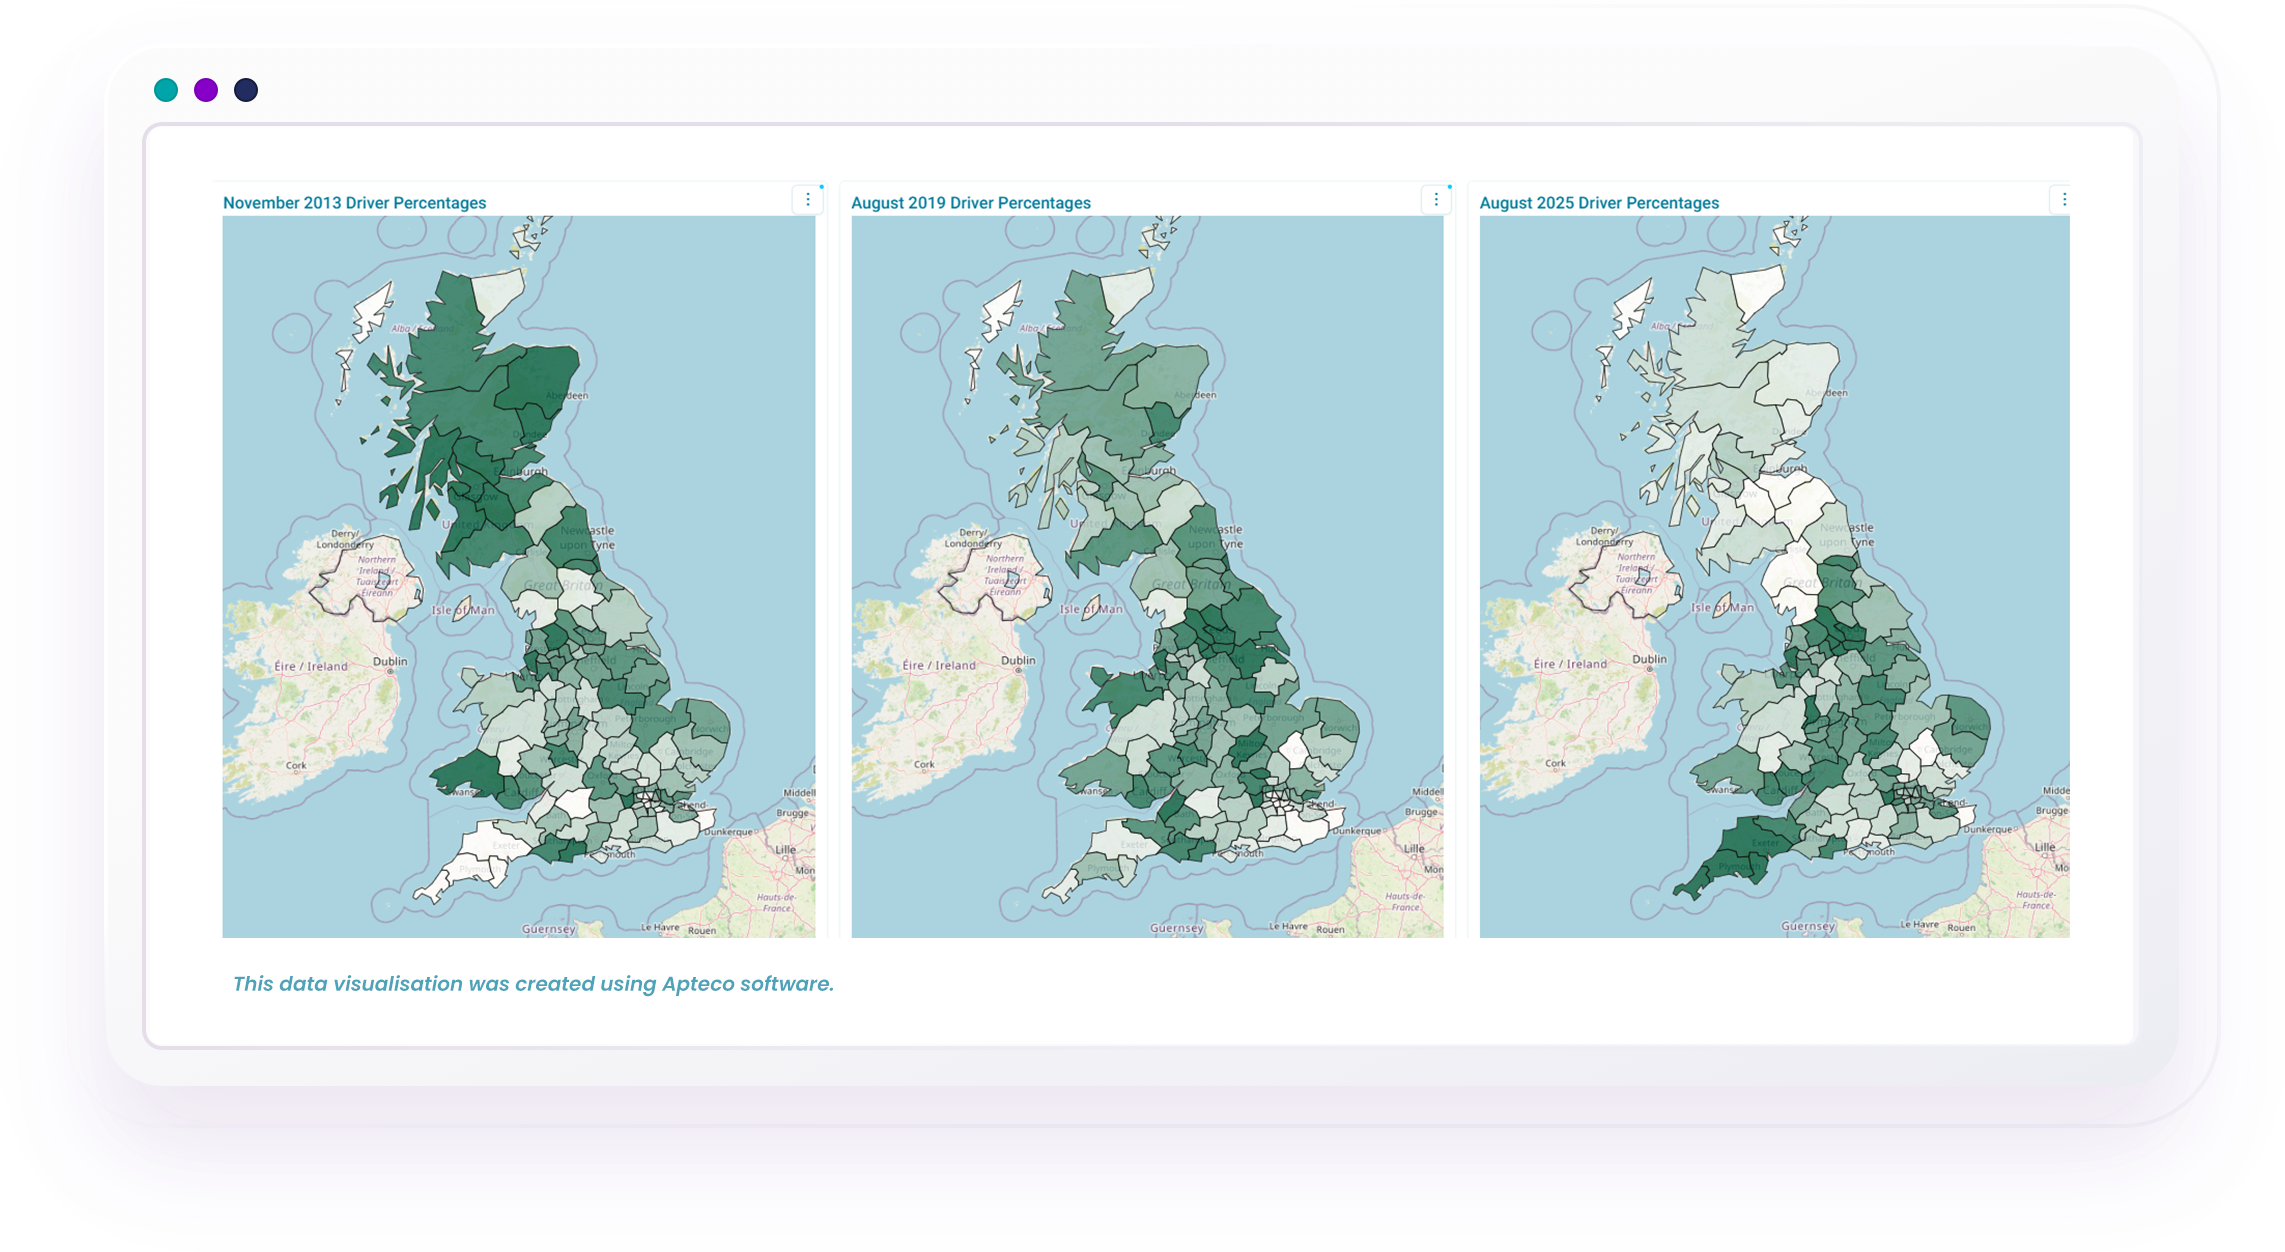
The chart below compares three different snapshots to show how these figures have shifted over time. It reveals a general decline in many areas, particularly from 2013 to 2019, and a stark contrast between regions. In the earliest snapshot (left panel), Scotland had a notably higher percentage of drivers with points, while the South West ranked among the lowest.
Moving to the middle and right panels, Scotland’s percentage drops, the South West rises, and Yorkshire consistently stays relatively high.
The data suggests a need for further investigation into the factors influencing these trends, especially in areas with significant changes.
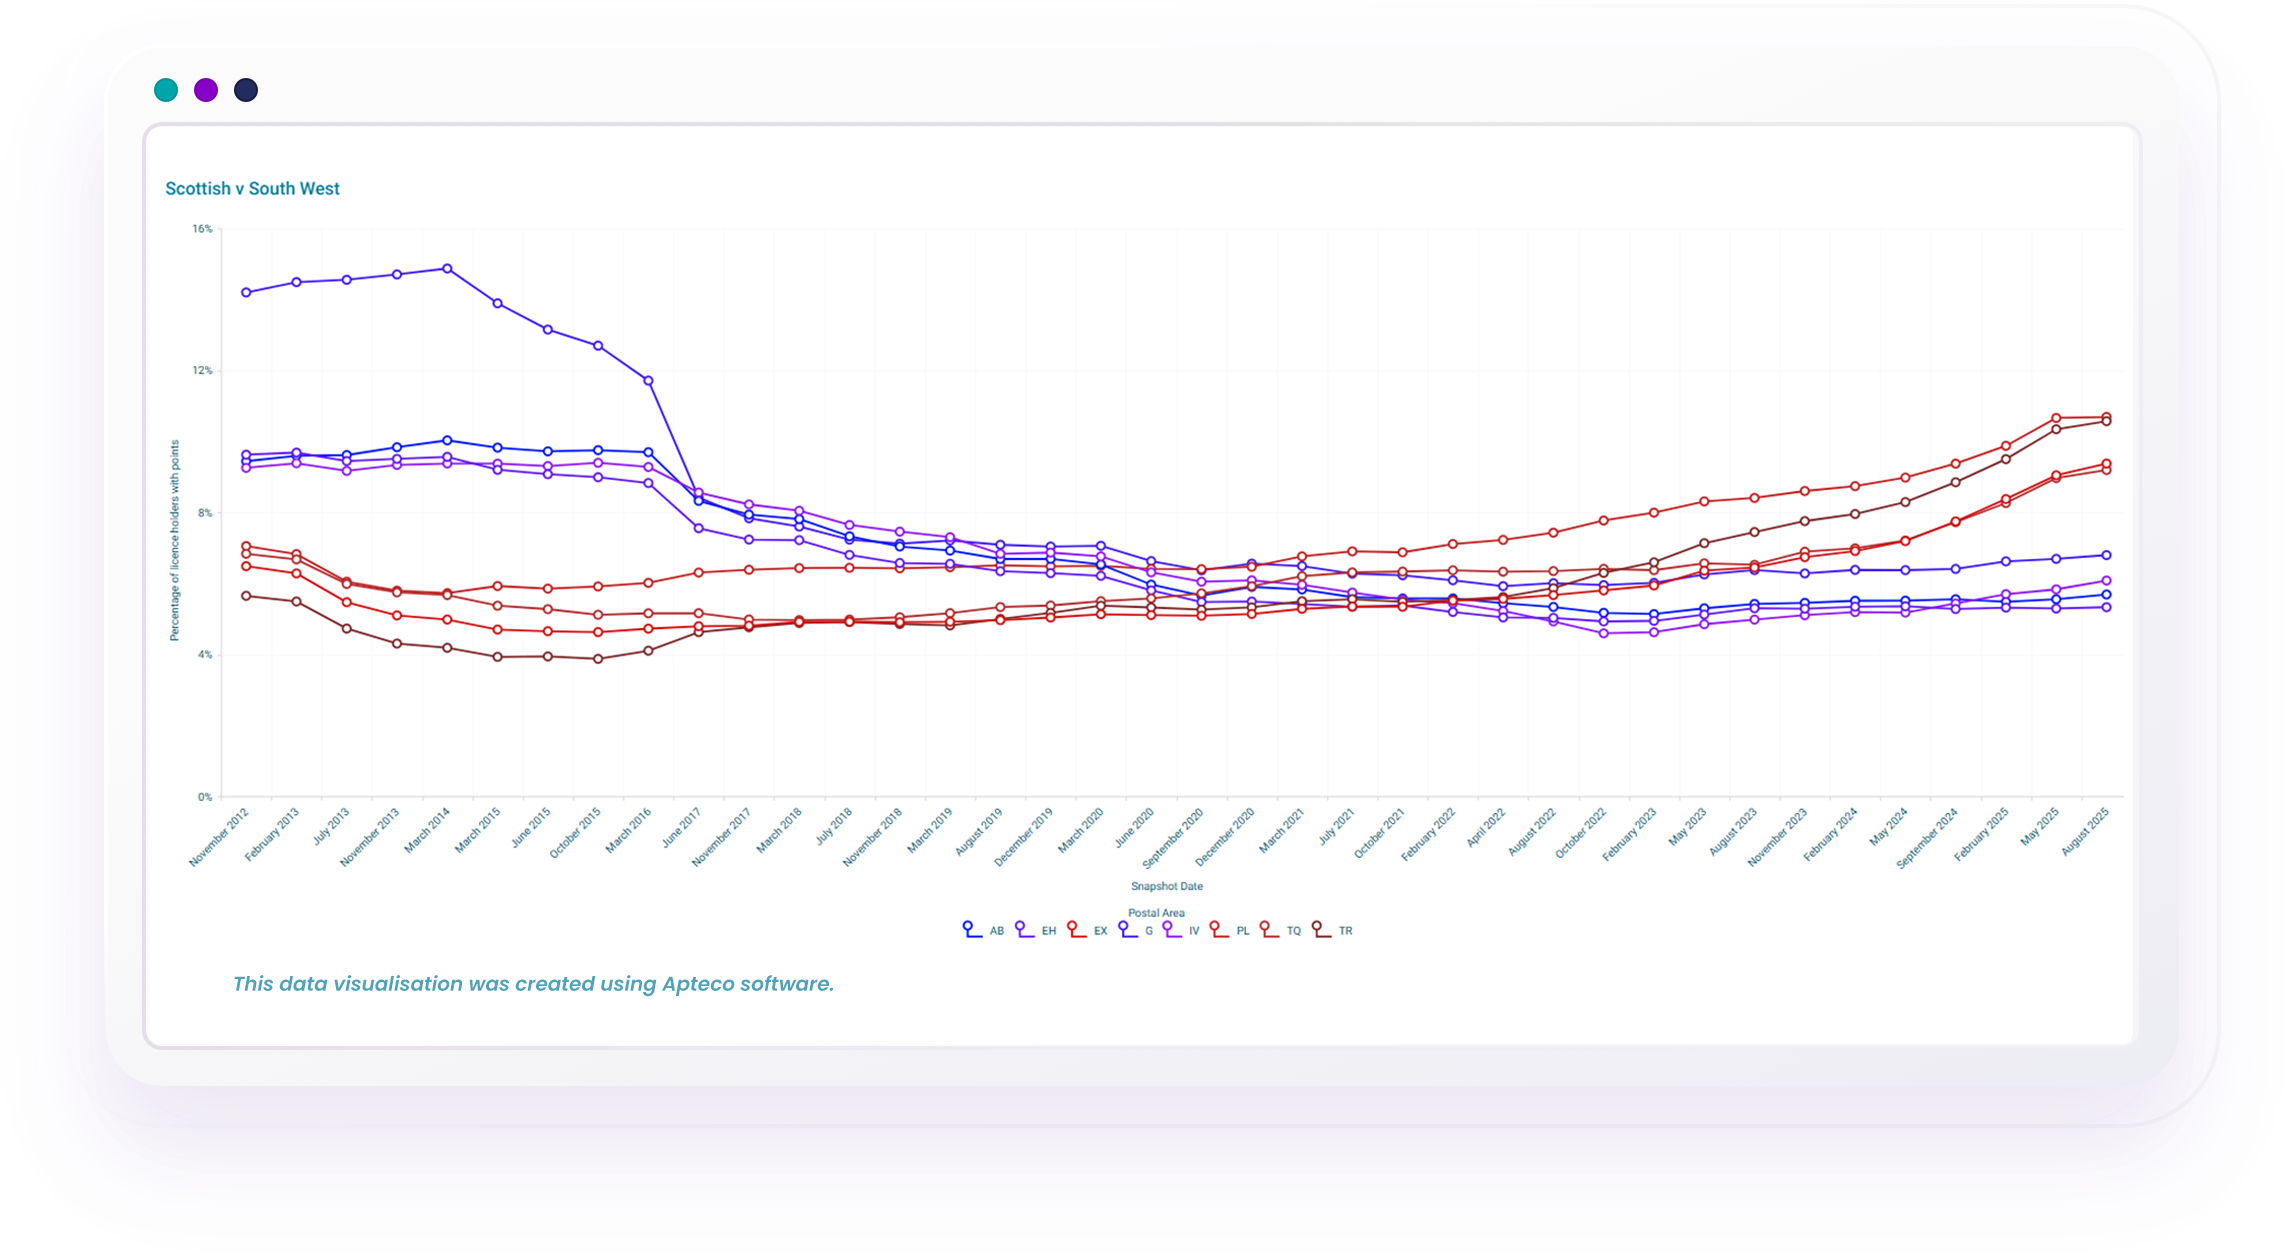
The line chart below tracks trends across all snapshots for four South West postal areas (TR, TQ, PL, EX – usually shown in red) compared with several Scottish areas (G, EH, IV, AB – typically in blue). Overall, the Scottish areas have seen a gradual decline over time, while the South West areas have steadily increased. Glasgow (G) stands out as an outlier, particularly in the early years, with much higher percentages than the other Scottish areas until 2016, when it finally aligned with the rest.
Concluding remarks
In this blog post we’ve highlighted a number of interesting time trends in licence holders and in the percentage of drivers with penalty points when broken down by age, gender and region. This dataset does not however give us the reasons behind those trends but gives interesting avenues for further investigation.
After reviewing over a decade of DVLA data, several clear trends emerge. Licence numbers have steadily grown, driven largely by younger drivers, though Covid caused noticeable disruptions. Penalty points remain concentrated among younger drivers, particularly males, while regional differences reveal shifting patterns across the UK - Scotland’s figures generally declined, the South West saw gradual increases, and Yorkshire has consistently stayed high.
While this dataset doesn’t explain the reasons behind these trends, these insights highlight not just who holds licences or points, it provides a clear view of how behaviours and regional patterns evolve over time and opens up several intriguing avenues for further investigation, from local driving habits to policy impacts and road safety initiatives.
Appendices
The data used in this post has come from GB Driving Licence Data - data.gov.uk. We have used data up to and including the August 2025 snapshot. A new snapshot for November 2025 has recently been released, although this has not been used in this analysis.