:format(webp))
A question of football - using FastStats to answer Guardian football knowledge questions
11 min read
Uncovering the parallels between marketing and football analytics
Each week, the Guardian newspaper in the UK publishes an online football trivia/stats column where they take readers’ questions on all sorts of football subjects. Some of these they answer themselves, for others they ask their readers if they can assist. I’ve been following this column for some time and have been regularly submitting answers where I can, and to date have had six of my contributions published.
Even though football statistics is not what Apteco’s software is primarily targeted towards, there are similarities between teams (to customers) and matches (to transactions) where attributes like
• When was something bought
• What was it
• How much did it cost
being equivalent to
• Match result
• Match date
• Goals scored.
To take a simple example, here are two equivalent questions, one from a marketing domain and one from a football domain:
“What is the longest consecutive sequence of same products bought?”
“What is the longest consecutive sequence of matches won?”
Answering football questions is beneficial to me in a few ways. Firstly, using the software we develop to answer real-world analytic questions shows where our powerful techniques can quickly assist in finding solutions. Secondly, it is a good exercise in improving skill in using our software that can be used when answering support questions from clients. Finally, if a problem turns out to be difficult to solve then this could lead to envisaging a new feature or idea.
In this blog, I am going to share some of the details behind the data analysis techniques I’ve used in some of these answers and share interesting insights from the world of football results!
The data and the questions
The breadth of the questions posed by the Guardian readers is extremely wide. Many of these questions analytics alone cannot answer, since they are pure trivia (e.g. “Brockenhurst United have a cattle grid on the entrance to their stadium - are they the only ones?”). For these questions, it is really only supporters that might know whether their club could be an answer to such a question. For other questions it is a matter of the data that I have available.
I have collected data on football match results only. These have come from various sources over the years (Note 1). I now update my data on an annual basis during each summer with the results from the previous season, so that I have all English league match data (from the first matches in 1888) up to the end of the most recently completed season for the top four divisions. I also have all of the international football data up to the same period (e.g. updated annually during the summer). Finally, I have a smattering of league data from some of the other European leagues (for one or two divisions and going back a small number of years).
This data has been built into a FastStats system structured as follows: (A team competes in one or more seasons in which they play one or more matches). This allows me to look at team to match type information as well as collate data on a season by season basis.
Other questions I cannot answer since they refer to data that I do not have available. For example, since I do not have any player data then questions like “Which player has been on the bench of their national team the most times, without ever making an appearance, even for a single minute?” I cannot seek to answer. Furthermore, questions that refer to things that happened during a match I cannot approach, e.g. “What’s the longest period in a game without the ball going out of play?”.
However, even with these limitations there still seem to be a large number of questions which I can seek to answer! In almost all cases, answering the question leads to being able to answer a whole family of other related questions, or indeed offers up tantalising new questions.
Simple analysis questions
In this first section, we cover some questions that can be answered using the tree and cube tools we have available in FastStats.
a) Longest sequence of the same scorelines to start the season. (See Article 1)
On September 29th 2021, a reader noted that: “Liverpool and Chelsea recorded the same scoreline in their first five Premier League matches of the season (3-0, 2-0, 1-1, 3-0, 3-0). Is this a record?”.
In actual fact, this is a record in the English leagues for the top four divisions for two teams recording the same set of scorelines to start a season in the same division.
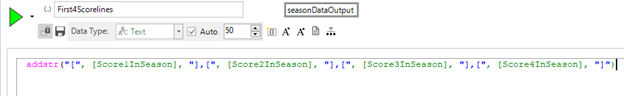
For this question, the first thing we need to do is to take the scorelines in each season in order and create a text string of those scorelines. An example is shown in the expression below to obtain the first four scorelines in a season.
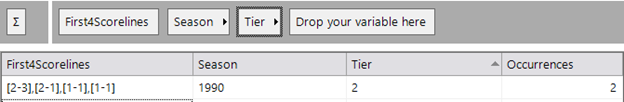
We can then use this expression as a dimension in the tree tool for those first four scorelines, and then also use the season and tier variables as dimensions and return all times this has occurred more than once. There is only one time that this has happened, when Bristol Rovers and Wolves recorded the scorelines shown below to start the 1990-91 season. In their fifth fixture their scores differed. Liverpool and Chelsea now hold the record for this particular question.
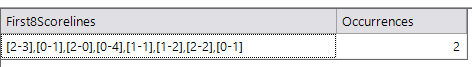
If we remove the constraints of the scorelines to start a season being from the same tier and the same season, then we need to extend the number of scorelines until we just end up with two that are the same. The record then becomes the following sequence of eight scorelines that started the 1991 season for Southampton in tier 1 and the 1965 season for Scunthorpe in tier 3.
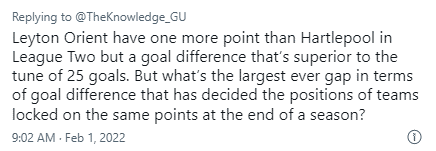
b) From the 2nd February 2022 column, there was a tweeted question as shown below which asked about the largest goal difference between two teams at the end of the season, where they are tied on points.
We can use the tree tool again to answer this, as it is very good at showing ordered records. We firstly need to create a variable that can identify all the teams in a league in a given season together.
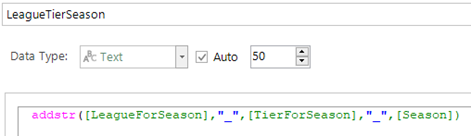
We then also need to know the total number of points each team scored in a season. This can be done using the aggregation wizards.
By using these as dimensions on a tree, we can then use the teams statistic to find out how many teams ended up on the same number of points in each season. Sorting would quickly identify an incredible season where eight teams ended up on the same number of points! (Note 2)
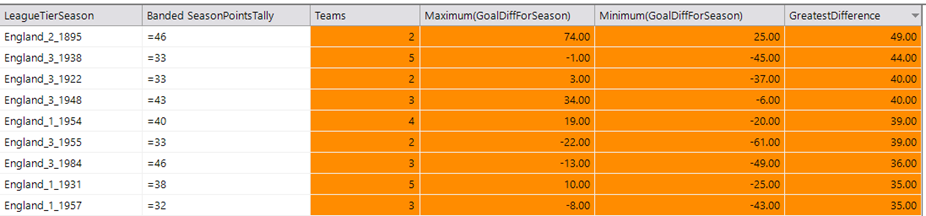
We then can add statistics for the maximum goal difference and the minimum goal difference for each of those teams on the same number of points, and then a calculated measure which is the difference between the two values.
The biggest such difference in this century was in the 3rd tier in 2018 when two teams (Bristol Rovers and Rochdale) finished on 54 points with goal differences of -3 and -33 respectively (giving a difference of 30) between those two teams, as shown below.

However, there are many instances in history where there were much wider goal differences between teams that finished on the same number of points. Back in 1895, two teams (Liverpool and Manchester City) finished on 46 points in tier 2 but with a goal difference of 49 between them. The list below shows all of the occurrences where the difference is at least 35.
c) In the column on the 19th January 2022, the following question came up…“With Boston United currently (Jan 17th, 2022) occupying a play-off spot despite having lost as many games as they’ve won, has a side ever finished a season in the play offs (or better, been promoted) with more defeats than wins on their record?”
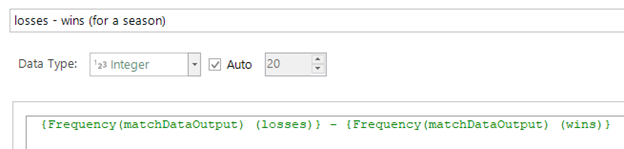
To answer this question, we need to create some aggregate values for league matches for a season. We need to know the total number of wins and losses in the league for a season and we can do this by using ‘On-the-fly aggregations’ in expressions (see previous blog articles – Note 3). The expression below works out the difference between the two. We need to find seasons for which this value <= 0 (i.e. as many defeats as wins).
The second thing we need is to know is the league position for the season. In order to be able to do this, we need to know the total number of points for a season (which we can do with a sum aggregation of points scored in a season), and the total number of goals scored and conceded (in order to be able to break tied teams).
The Numeric Banding wizard can rank the teams in each group of (‘Division and Season’) to give a value from 1 to N for that particular division/season.
We can then look to make a selection of teams who achieved a position higher than N as follows:
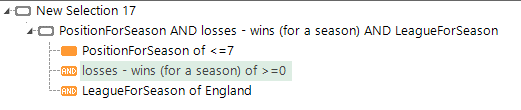
This will give us all the teams who have finished at least 7th with as many losses as wins. The most recent occurrence of this was for West Ham in 2001.

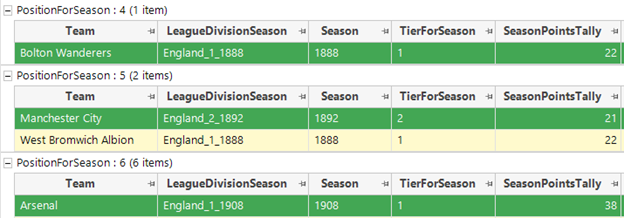
To do better than this, we have to go back well over 100 years. In the grid below, the highlighted rows shows the most recent occurrence for teams placed 4th (only happened once), placed 5th (only happened twice) and placed 6th (happened 6 times).
Sequences of interesting matches (or seasons)
A common requirement in marketing analytics is to be able to look at sequences of products a customer has bought, or sequences of interactions that they have had. This type of question is also very common in football analytics questions too, as supporters are always keen on looking at streaks of good/bad results/seasons for instance.
In the column on March 2nd 2022 was the following question (see Article 3):
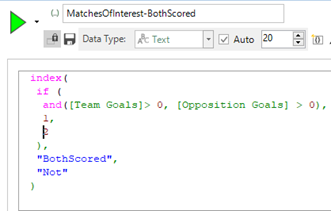
“Bristol City’s 2-1 win over Middlesborough on 19 February 2022 was their 12th consecutive league game in which they have both scored and conceded. What’s the longest such streak any team has managed?”.
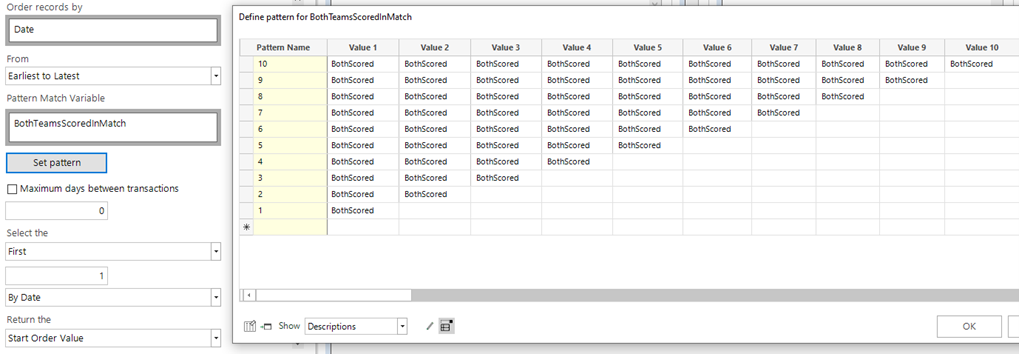
Any question that has the word ‘streak’ in it is a good candidate for the Pattern Match functionality. To do this, we need to order matches by a date variable, and then use a categorical variable to define the characteristics of the streak. The selector variable we need here is a simple one that identifies whether a match is one where both teams have scored. We can do this by creating an expression like this and turning it into a categorical value:
We can then use it in a Pattern Match definition, filtered to a selection of English league matches.
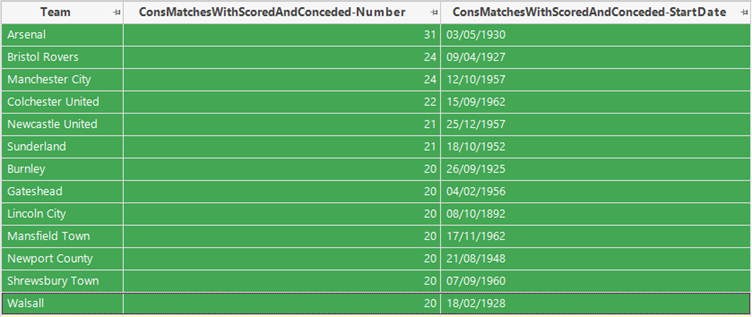
We can then order teams by that metric, as shown in the data grid below, to show that Bristol City’s sequence was not remarkable at all!
A similar approach could be used to answer the following question that appeared in the April 13th 2022 edition (see Article 4):
‘“If Luton Town finish higher than 12th in the Championship, which looks increasingly likely, it will be the seventh consecutive year they have improved their league position. Would that be a record?”
In turns out that this is not only not a record, it is not even Luton’s best effort! In the top four divisions of the English leagues, the record stands at nine seasons shared jointly by Luton (starting in 1978), Oldham (from 1969) and Gillingham (from 1994).
The main requirement needed in order to answer this is to be able to rank the teams in the leagues for a season from 1-92 (or the total number of teams across the four divisions!). We can do this with a variation on the earlier league position that also takes into account the division to give a score.
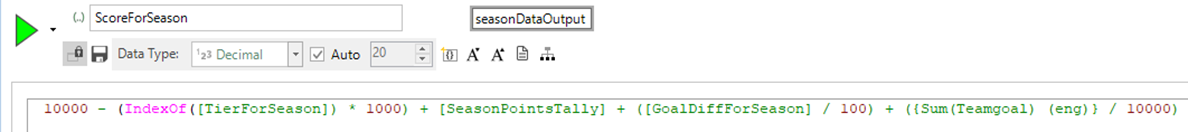
Once we have this score, we can then use the Numeric Banding wizard to rank the teams (grouped by season) to give a rank from 1-92 for each season. I have then created this as an ascending selector for use with the inequality operators in the pattern match.
We can then look for patterns where the values successively decrease (i.e league position gets better). This can then lead us to find the longest sequence for each such team. Once set up, it is not then difficult to use different equality symbols to find answers to similar questions:
- Longest sequence of improving seasons (9 – Luton, Oldham, Gillingham). In Oldham and Gillingham’s cases their final positions at the end of these sequences represented their best ever league performances.
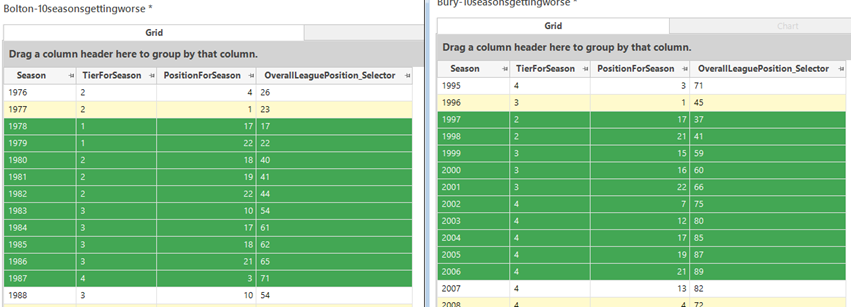
- Longest sequence of deteriorating positions (10 – Bolton and Bury). In both cases, prior promotion (or 2 for Bury) was the catalyst for a decade of worsening performances, as shown in the two grids below.
- Longest sequence of exactly the same league position (3). There are 24 times that this has occurred, most recently by Stoke City who from the 2013/14 season finished in ninth place for three consecutive seasons.
Concluding remarks
I have not covered all of the questions that I’ve answered from these columns in this article (see articles 2, 5 and 6), but have chosen to focus on a subset of those problems that have involved cubes and sequences. For a couple of those not discussed here, there were improvements that could be made to the software to make them quicker to answer and where there were obvious and direct analogies of marketing analytic questions. These will be introduced into our software in the near future.
As a result of these answers, I have now developed a good range of useful additional variables which will subsequently make similar questions easier to answer. In the future, I will continue to supply answers to readers questions when I can, and if you have any burning questions then do feel free to submit them to the column, or contact me directly!
Reference articles
Article 1 – Answer to longest sequence of same scorelines to open a season, in column:
Which football club has been managed by the most World Cup winners? | Football | The Guardian
(Published on Sep 29th 2021)
Article 2 – Teams in same division having two successive promotions/relegations, in column:
Wild two-year twists of fate for football clubs in the third tier | Football | The Guardian
(Published on Dec 1st 2021)
Article 3 – Longest streak of matches in which both teams scored, in column:
Has a player been older than both managers in a football match? | Football | The Guardian
(Published on March 2nd 2022)
Article 4 – Consecutive seasons improving league position, in column:
Footballers named after politicians, from Tony Blair to Mahatma Gandhi | Football | The Guardian
(Published on April 13th 2022)
Article 5 – Teams playing both fixtures against an opponent in August or May, in column:
Extreme examples of lower-league teams in huge stadiums and vice versa | Football | The Guardian
(Published on May 4th 2022)
Article 6 – Pairs of teams yo-yoing between divisions, in column:
Which football clubs have won the league title in their centenary year? | Football | The Guardian
(Published on May 25th 2022)
Reference notes
Note 1 – I have built this data set up over a number of years from a number of sources and update it annually after the end of each season with all of the results from the previous 12 months.
Note 2 – I’ll leave this tantalising titbit to the reader as an exercise to find out!
Note 3 – A series of blog articles about using aggregations in expressions in FastStats:
On-the-fly Aggregations part 1 | Apteco
On-the-fly Aggregations part 2: What happens next? | Apteco
On-the-fly Aggregations part 3 | Apteco
Sequencing Transactions With Pattern Matching, Part 1. (apteco.com)