:format(webp))
Sequencing transactions through pattern matching – Part 2
How Apteco FastStats® can identify patterns and draw insights from customers’ purchasing history.
Digging deeper into functionality
In a previous blog post, we introduced the idea of pattern matching as a way of understanding sequences of transactions for a customer. This powerful technique can be used to both select and analyse a customer database and provide insight into interesting transactional behaviour.
The functionality introduced in the previous blog extended functionality considerably and also made it easier to create some scenarios that were already possible.
However, there were still many further questions that were not possible to answer with the functionality as introduced in part one. In this blog we explain these new features and describe how we can use them to answer some key questions.
Pattern matching
The existing functionality allowed us to return the name of the pattern if it was matched. There are many circumstances where we may want to return an alternative value. For instance:
- With hundreds or thousands of transactions for a person it may be difficult to validate when exactly (or indeed if!) the pattern occurred.
- We may want to know exactly when a pattern started or ended to then be able to select upon it for marketing campaigns.
- We may want to know the amount of time it took for a pattern to happen to be able to select from patterns that occurred within a specific time frame.
- Where there are patterns with wildcards, or multiple patterns of different lengths, it can be useful to return the start or end value, or how many transactions the pattern took.
These scenarios are all supported through one extra dropdown control that allows you to choose the value to return. In each case, the data type of the aggregation is set appropriately and this can then be combined with other expression functions in more advanced scenarios.
It can also be useful to return the number of times a pattern was matched. For instance, we can look for a particular sequence of transactions and select based upon the frequency of that occurring for the person. These patterns can be overlapping or encompass entirely different transactions. An example on our holidays system would be to select people who have been to Australia and then the United States more than once.

There are also useful techniques here for selecting people based upon their loyalty to buying the same product repeatedly. We’ll do this by counting the number of times a customer switches between destinations. We can do this as follows:
- Create a pattern of “==” where we return the number of patterns
- We then subtract this value + 1 from the total number of bookings for the person
Let’s assume we have had four bookings and they had been for a product A or B.
AAAA = 4 (bookings) – 3 (== patterns) -1 = 0.
AABB = 4 (bookings) – 2 (== patterns) -1 = 1.
ABAB = 4 (bookings) – 0 (== patterns) -1 = 3.
This can give a loyalty measure that can then be used to segment people for appropriate marketing treatments.
Wildcards
In our previous blog post we introduced three wildcards (?, *, =) that respectively matched any one transaction, any 0 or more transactions, or ‘this pattern element was the same as the previous one’. Here we introduce three further types of wildcards.
- The wildcard ‘<>’ is useful in identifying pattern elements that are different from the previous one. The previous element can be a fixed value (e.g. USA <>) or it could be repeated wildcards (e.g. <> <> <> for three different ones in a row).
- Some transactional variables have a natural ordering to them. For instance, a product variable might be ordered from the least important up to the most important, or a destination variable might be ordered based on the distance of travel from the UK. For variables that have these characteristics it can be useful to look for sequences with transactions that are changing in importance. This has been supported through the use of the inequality wildcards (<, >, <=, >=). For example:
- The pattern ‘France >’ means ‘has been to France, then to a more important destination than France.
- The sequence ‘> > > > >’ is a consecutive sequence of five transactions of increasing importance (ref n). In this way we can look for customers with patterns where there are ‘upgrades’ or ‘downgrades’ in consecutive transactions.
- The third is actually a set of wildcards of the form ‘?N’ where N is a number. This allows a transactional value to be anything on first use and then remembered in the pattern to ensure that a particular future pattern value is definitely the same or definitely different to this one.
Here are some examples:- ?1 ?2 ?1 – anywhere, somewhere different, then back to the first
- ?1 ?2 ?3 – three consecutively different destinations
A second use case for the “?1 ?2 ?1” example above and the number of matches described earlier can enable users to look for people by their propensity to flip between a first and a second product and back again.

Some more involved examples
In previous blog posts we have undertaken analysis on both international and English league football results. In this section we will revisit that data to answer more questions. The answers are given in the appendices at the end of the blog.
- In international football, which team has had the most consecutive matches before repeating the same scoreline?
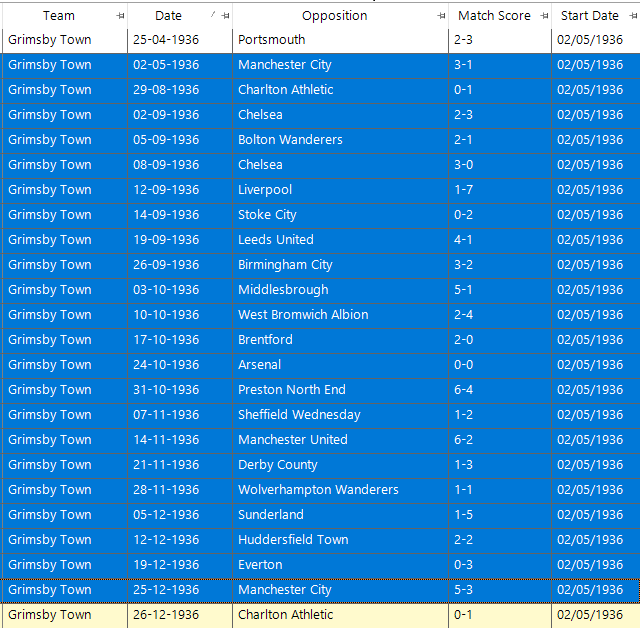
- In English league football, which team has had the most consecutive different scorelines before repeating any of them? When did this happen?
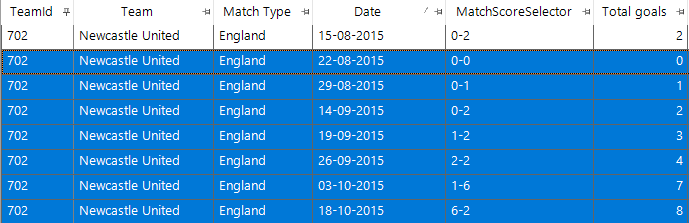
- In English league football, which team has had the most consecutive matches in which more goals were scored than the preceding match? What about fewer?
- What is the difference if we allow the sequences to include equals as well (e.g all less than or equal/more than or equal to previous?)
Conclusions
This blog post has introduced functionality that has been introduced in the Q2 and Q3 2019 releases. These new features enable a wider range of pattern matching scenarios to be expressed in FastStats to analyse or select people by sequences of transactions. It has also given us a chance to delve further into football statistics!
Look out for a third blog post on the subject of pattern matching, which will introduce features from Q4 2019.
Some football related pattern match answers
- Scotland! A sequence of 128 matches starting on 03/03/1923 and ending on 14/04/1956.
- Starting on 02/05/1936 and lasting until 25/12/1936 Grimsby Town had 22 consecutive league matches before repeating any of the scorelines.
Three other teams had 21 consecutive league matches (Carlisle starting on 07/02/1953, Manchester City starting on 01/10/1894, Wrexham starting on 29/09/1965). Since the turn of the millennium the longest run is 18 matches starting on 13/05/2001 by Bradford City. - For increasing matches the sequence is seven for Newcastle United in 2015 as shown in the screenshot below. We do not know in advance how many matches the longest sequence will be so I set out a pattern of 10 >, then 9 > etc down to 1 > to find the longest increasing sequence for each team and put this on a cube dimension. I then chose the one team with a seven-match run. To find when it was I then added a data grid with the relevant fields and also a date field to show when the sequence started so I could find the sequence in the thousands of matches that Newcastle United have played.
The longest such sequence of descending matches by an English team is by Hereford United in 1996, but their seven-match sequence included an FA cup match as well, rather than all league matches. - If we relax the constraints then we get 12 consecutive results from Blackpool starting on 23/12/1972 where the number of goals scored in the match is the same or less than the previous one. Incidentally in the middle of this sequence is an FA cup match that also maintains the same property. The best sequence for the same or more goals in English league football is 11 by Chesterfield in 1925, Swansea City in 1981, Aldershot in 1990, Newcastle United in 1996 and Stockport County in 2006.
This is the second part of a series with four parts. Click here to access the next part of this blog series.