:format(webp))
Have UK roads become safer in the past 40 years?
9 min read
Introduction
Have the UK roads become safer over time? We will look at UK road safety through the analysis of road traffic crashes over the last 40 years to see if we can answer this question. In previous blogs of this style (Note 1), we have presented all the analysis in Apteco FastStats visualisations. In this post we are showing some of these as visualisations from our new Orbit platform.
Data collection
The UK government has made data available that stretches back to 1979 covering traffic crashes in the UK (Note 2). This data is collected by the police using a form called STATS 19 that is filled in following a crash. The dataset is not a complete and accurate account of all the crashes on the UK roads as they are only the ones that were dealt with by the police. Crashes have been classified as ‘Fatal’, ‘Serious’ or ‘Slight’. Almost all fatal crashes should be included in the data, and a significant number of the serious ones, but only a subset of all slight crashes are included – namely the ones that trigger police involvement (Note 3).
Although the raw data is available for download, I have made use of a very handy R package (Note 4) that saved plenty of time in preparing the data ready for loading into FastStats. The structure of the resulting system is such that there are 1.4 million crashes that had 1.9 million casualties and involved 2.6 million vehicles. Note that in this blog post, I have included crashes up to the end of 2019.
A number of details are included about each crash. We know how serious the crash was, where it happened, when it happened and then a number of factors about the site of the crash such as road type, weather conditions, junction information, road conditions, and the police force involved.
For all the vehicles involved in crashes we know the type, the age, information about the driver and a bit of information about what happened to the vehicle. For each casualty we know their age band and their gender.
Some simple exploratory analysis
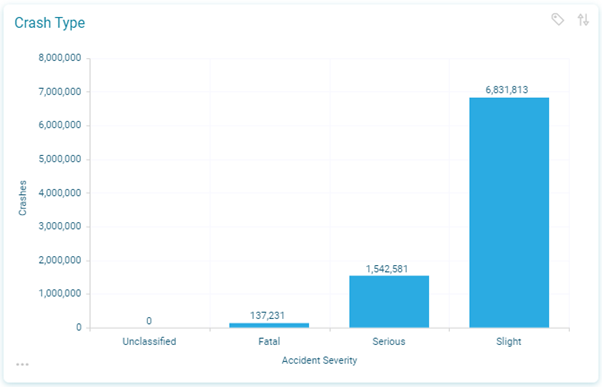
In the previous section, we noted that we are more confident that the numbers of fatal and serious crashes are more complete, and therefore it seems a good place to start to look at just the serious and fatal crashes. Below we can see that about 1.7 million of the 8.5 million crashes fall into these categories.
An obvious starting point is to start by seeing if the total number of crashes is coming down over time since we have 40 years’ worth of data here.
Let us look at fatal crashes first:
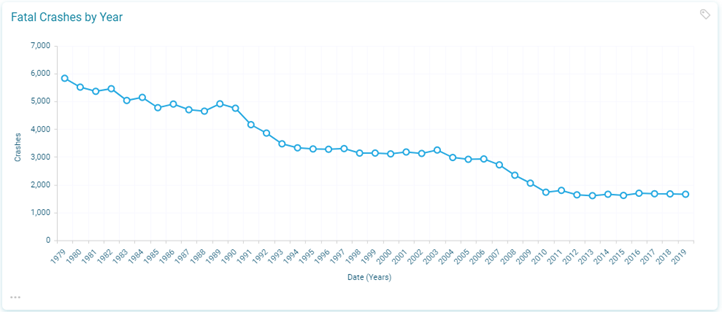
The main trend here is the historical fall from a high of 6,000 to around 3,000 in the mid 1990’s. A further sustained fall in the late 2000’s has seen the number stabilise between 1,600 and 1,700 for the last decade.
If we consider the serious crashes only:
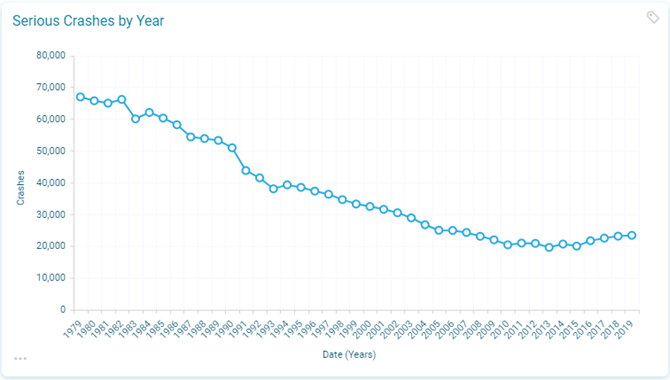
The number of recorded crashes of this severity have fallen dramatically from over 65,000 to around 20,000 per year in the mid 2010’s, before rising again into the mid 20,000s over the last 4 years of the data.
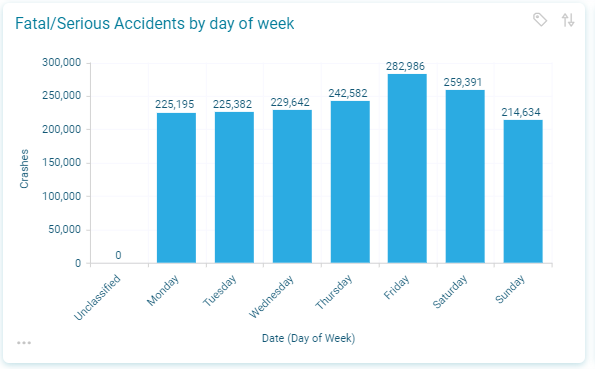
If we slice the date/datetime information in a different way, then we can look at the crashes in a different way. In the chart below, we can see that most fatal crashes are recorded on Friday and the least on a Sunday. We cannot deduce that Friday is a more dangerous day on the road since we would need to index these crashes against the total number of vehicles or journeys on the road on those days.
If we break it down in another way, then we can look at crashes by hour of day. Below is a subset of crashes since 2000 that shows peaks of fatal/serious crashes around the morning (small peak) and the evening rush hours (biggest peak). Unsurprisingly, the time of the day with the least number of fatal/serious crashes is in the middle of the night.
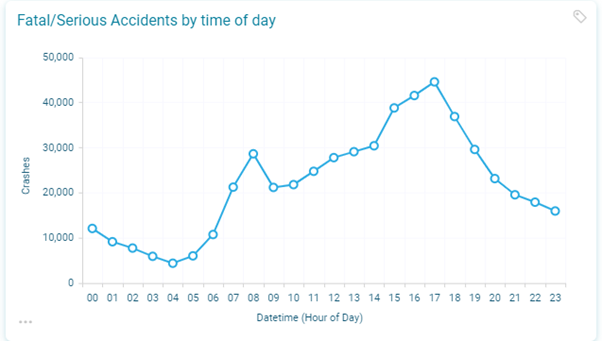
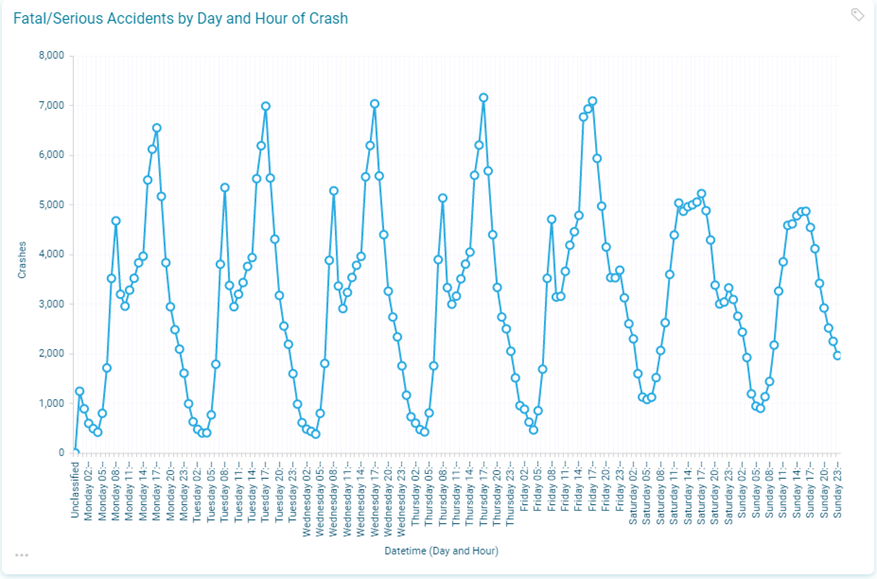
There is a slightly different time profile for each of the days of the week, with the weekdays having distinct small peaks in the morning and bigger ones in the afternoon. The weekends have a different pattern with a much larger and flatter afternoon peak of crashes. Finally, it is also noticeable that Friday evenings (21:00-23:00) and Saturday evenings (21:00-00:00) have a distinctly different pattern of fatal/serious crashes to the other days of the week.
In this so far, we have only used two of the available pieces of information about the crashes, namely the severity and when it happened. Let us now look at a couple of the other variables that we could break down these fatal/serious crashes by.
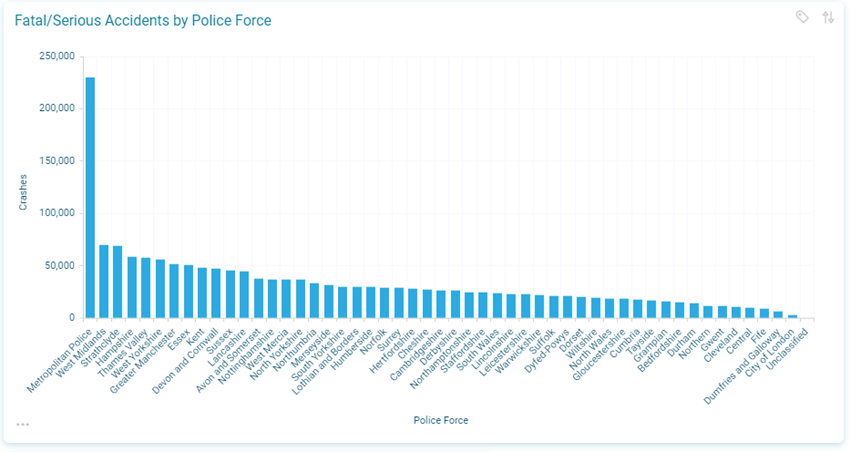
In the chart below we are showing the numbers of fatal/serious crashes recorded by police force. Again, this is not a reflection of how dangerous the roads are in those particular areas, as the ones with more crashes are undoubtedly in areas of much higher population and higher numbers of road users. So, again we cannot conclude that those areas are more dangerous, unless we could link it to some measure of road journeys undertaken.
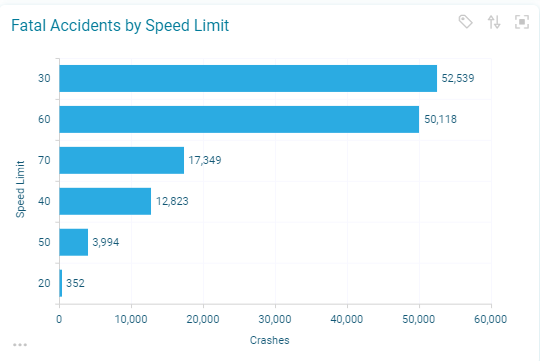
One factor which would seem to be naturally important in the determination of fatal/serious crashes would be the general speed of the vehicles on the road – with a higher likelihood of more severity being caused by vehicles travelling at higher speeds. The chart below shows that actually the highest number of such crashes are overwhelmingly in the 30mph speed limit category.
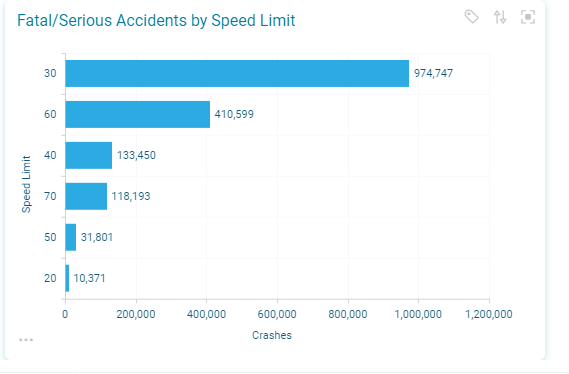
However, if we only include fatal crashes though, the higher speed limit categories have increased in proportion to the lower ones – and indeed we will see in the next section that speed limit is the most important factor in differentiating fatal crashes from non-fatal ones.
Having looked at different ways of exploring the characteristics of fatal/serious crashes, this naturally leads us to think about the relative importance of these factors to each other in determining whether a crash was likely to be fatal or not.
What causes fatal crashes?
A typical way of trying to identify the key factors which differentiate fatal crashes from non-fatal crashes is by using the Apteco FastStats profile tool. Our selection of interest is all fatal crashes, and our selection to compare this to would be all crashes. We could then add in all the possible attributes that are included in the data into the profile and see which are identified as the most predictive factors.
The main difficulty with this is that we only have a subset of the slight crashes so any bias in the collection of data on those crashes will then show up in the overall analysis results (Note 3). Here are some of the factors which appear to be predicative of whether a crash will be fatal:
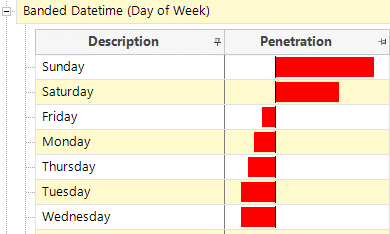
The first hypothesis here is that crashes on the weekend are likely to be more fatal. The previous bar-chart had shown that Sunday had the lowest number of fatal crashes by day of week, yet the above tells us that they are more likely to be fatal – because there will be correspondingly far fewer slight crashes recorded. Whilst this may be a correct insight, an alternative data-collection based explanation could be, ‘there are less police officers on duty over a weekend and less slight crashes are therefore recorded than should be’, which would also lead to this result. We therefore need to understand the limitations of the data collection as well as the context of the data in knowing when we can draw conclusions from our analysis.
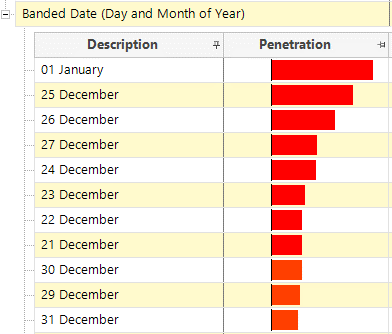
Similarly, if we banded the above by the actual day of the year, we would find a pattern that the days around Christmas seemed to be the time of the year when we would expect most fatal crashes. This could be true, but this also seems to suggest that it could be that fewer than expected slight crashes are recorded in periods when more police officers would be on holiday.
These results should make us stop and think quite carefully about drawing any insights about factors that are important in determining whether a crash is likely to be fatal.
Other factors that the profile suggests are relevant to fatal crashes include:
- Lighting conditions – crashes in dark conditions are more likely to be fatal. However, again it could be that these (night-time) reasons are due to a lower reporting of slight crashes in the middle of the night.
- Rural/urban – crashes in rural areas tend to be more likely to be fatal. This could be due to slower speeds of vehicles in urban areas, or due to a lower reporting of crashes in areas with less police officers.
- Police force – this is linked to the previous factor. Rural police forces tend to have higher incidences of fatal crashes, but is this due to slower traffic in London/Manchester than in rural areas? Or because more slight crashes are recorded in those areas?
- Weather conditions – high winds and fog tend to have more fatal crashes than fine weather, low winds, or even snow. This seems like a factor that maybe isn’t linked to the reporting of crashes as much. Perhaps drivers are much more cautious in snowy conditions.
- Road speed limit – roads with a speed limit of 60mph, then 70mph feature at the top of the list with regards to proportions of fatal crashes. This factor comes out as the most important in determining fatality, and that does not seem too surprising as there is more likelihood of severity at higher speeds.
- Towing and articulation – articulated vehicles, or those with trailers suggest that these are extremely important factors in whether a crash is fatal or not.
- Age band of driver/Age band of casualty – the data suggests here that drivers of vehicles involved in fatal crashes, and those most likely to be casualties are from older age groups with the over 75 age group most heavily over-represented in the fatal crashes category.
- Sex of driver – would giving this information finally answer that question of who the safer drivers are?
There are also some variables where we need to be careful about drawing insight: - Many variables are linked (e.g., hour of day and lighting conditions, speed limit and road type are two obvious examples).
- Factors which are indicative of a serious crash (e.g., police officer attending scene, number of vehicles involved, number of casualties) are deemed to be important but whose values may depend on the severity of the crash.
Conclusions
The discussions above have shown how important it is to understand the limitations of the data that you are using when drawing conclusions about the insights that appear. Failing to consider this could lead to misunderstandings about important factors in your data and incorrect strategic decisions when taking action based on that insight.
Returning to the question posed in the title – have the UK’s roads become safer in the last 40 years, it certainly appears that is the case from first two line charts that showed a significant drop in the number of fatal and serious accidents over time. The data does not allow us to draw conclusions as to why this pattern has been observed. It could for instance be partly due to the mandatory seatbelts law in 1983, improvements in vehicle safety, but we can’t say for definite.
This blog has been written by Chris Roe, and builds upon earlier work and ideas from our Apteco interns Jakob Schmutz and Tom Campbell.
Notes
Note 1 – see for example previous blogs on athletics (Who really is the UK’s best athlete? | Apteco) or flights data (The Apteco Datathon: 1. Analytics on flight delays | Apteco), amongst others.
Note 2 – The road safety data is found at the following location (Road Safety Data - data.gov.uk) and is available for use under an open government licence.
Note 3 – On completeness of the data, on the Road accidents and safety statistics - GOV.UK (www.gov.uk) website it says the following:
“Comparisons with death registration statistics show that very few, if any, road crash fatalities are not reported to the police. It has long been known that a considerable proportion of non-fatal casualties are not known to the police, as hospital, survey and compensation claims data all indicate a higher number of casualties than are reported to the police.
However, Stats19 remains the most detailed, complete and reliable single source of information on road casualties covering the whole of Great Britain, in particular for monitoring trends over time.”
Note 4 – The R package ‘Stats19’ makes the job of downloading and wrangling the crash data much easier, and it only required a limited amount of extra code to ensure the fields were longitudinally consistent across the 40 years before using these as input to a FastStats design.