:format(webp))
Actionable insights with Apteco dashboards
:format(webp))
Empower your team to make decisions based on data-driven insights
Apteco dashboards provide a clear and concise means of visualising and interacting with your customer data or customer data platform (CDP). In today’s diverse working environments, people need smart, flexible tools to achieve their goals quickly and efficiently. Now you can easily customise beautiful, branded dashboards to share insights across your organisation, with visualisations that are updated automatically to reflect the latest data refresh, so your team can always work with up-to-date information.
Intuitive and easy-to-use
Reduce the need for training, or a reliance on colleagues with specialist skills.
Filter and slice to build custom views
Add filters and drill-down to explore your data for an even clearer picture of your customers or CDP.
Selection of chart types
Choose from a large variety of charts types – from bar, to line, donut to pie, maps, funnels and radar charts, Venn diagrams and stacked charts.
Secure sharing
Easily share a non-editable view of your dashboard with selected individuals or groups, even if they are non-Apteco licensed users.
Customised branding
Keep your brand at the forefront by adding logos and colour themes to your dashboards.
Access from anywhere
Dashboards can be designed for all screen sizes and resolutions, ensuring an optimal experience on any device.
Apteco dashboards can be easily designed and customised for specific business scenarios.
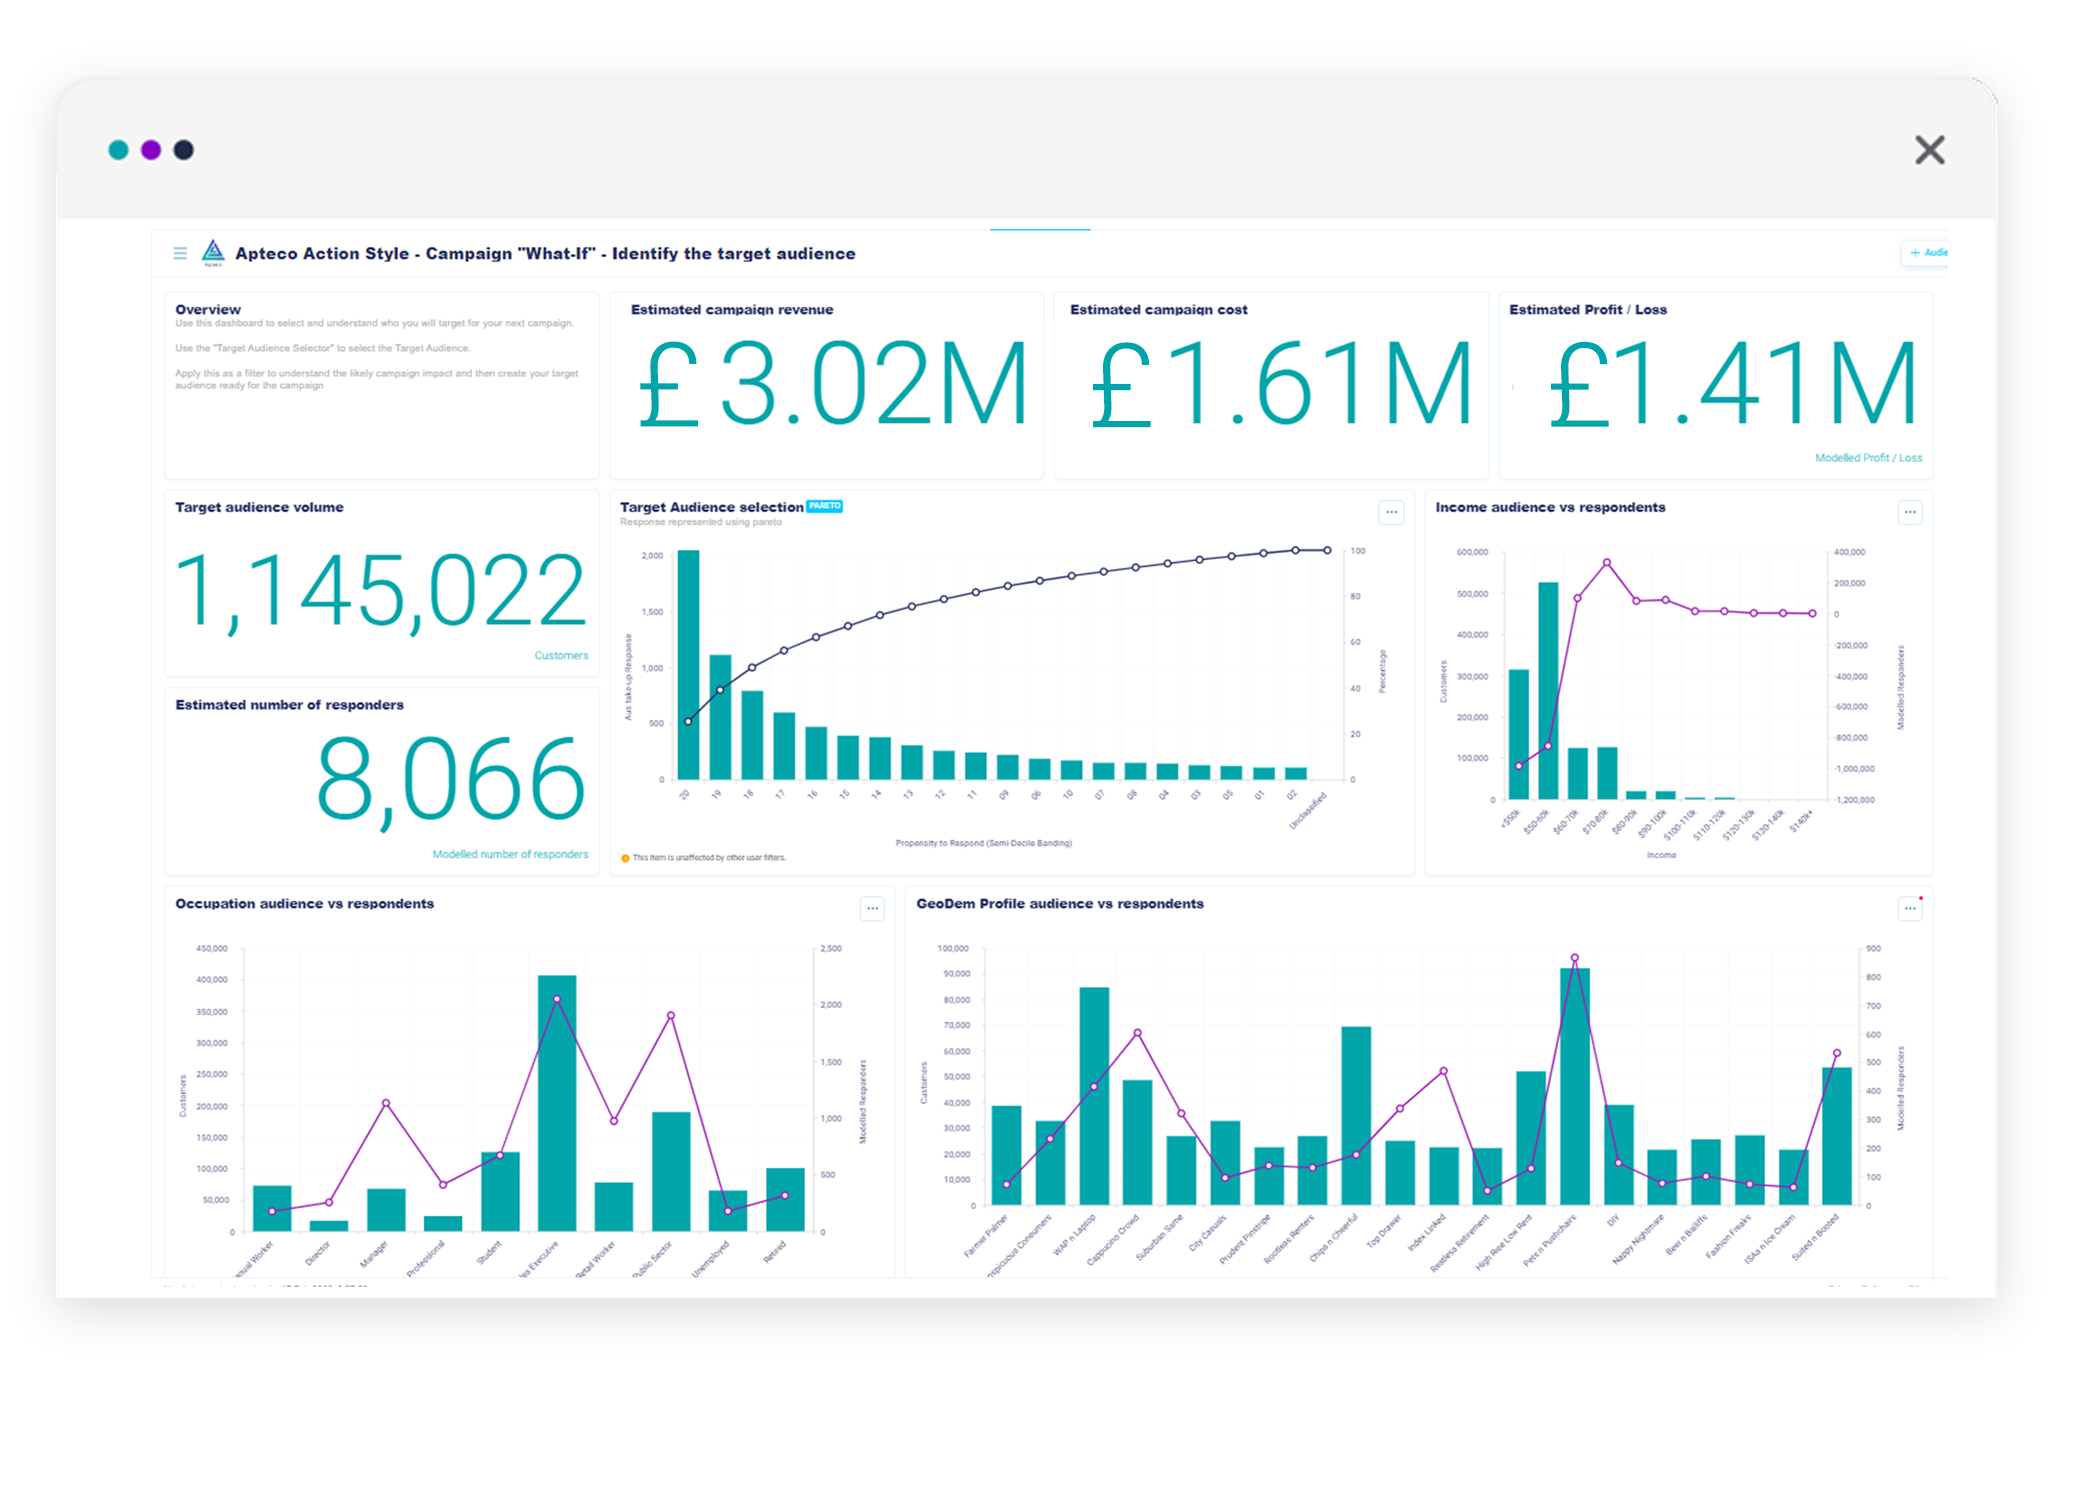
Action style dashboard
The action dashboard enables analysis to be run and a mitigating strategy to be launched from the dashboard. An end-user can test hypotheses to optimise an outcome and democratisation of data is achieved using AI to simplify complex data analysis principles, ensuring accuracy and consistency.
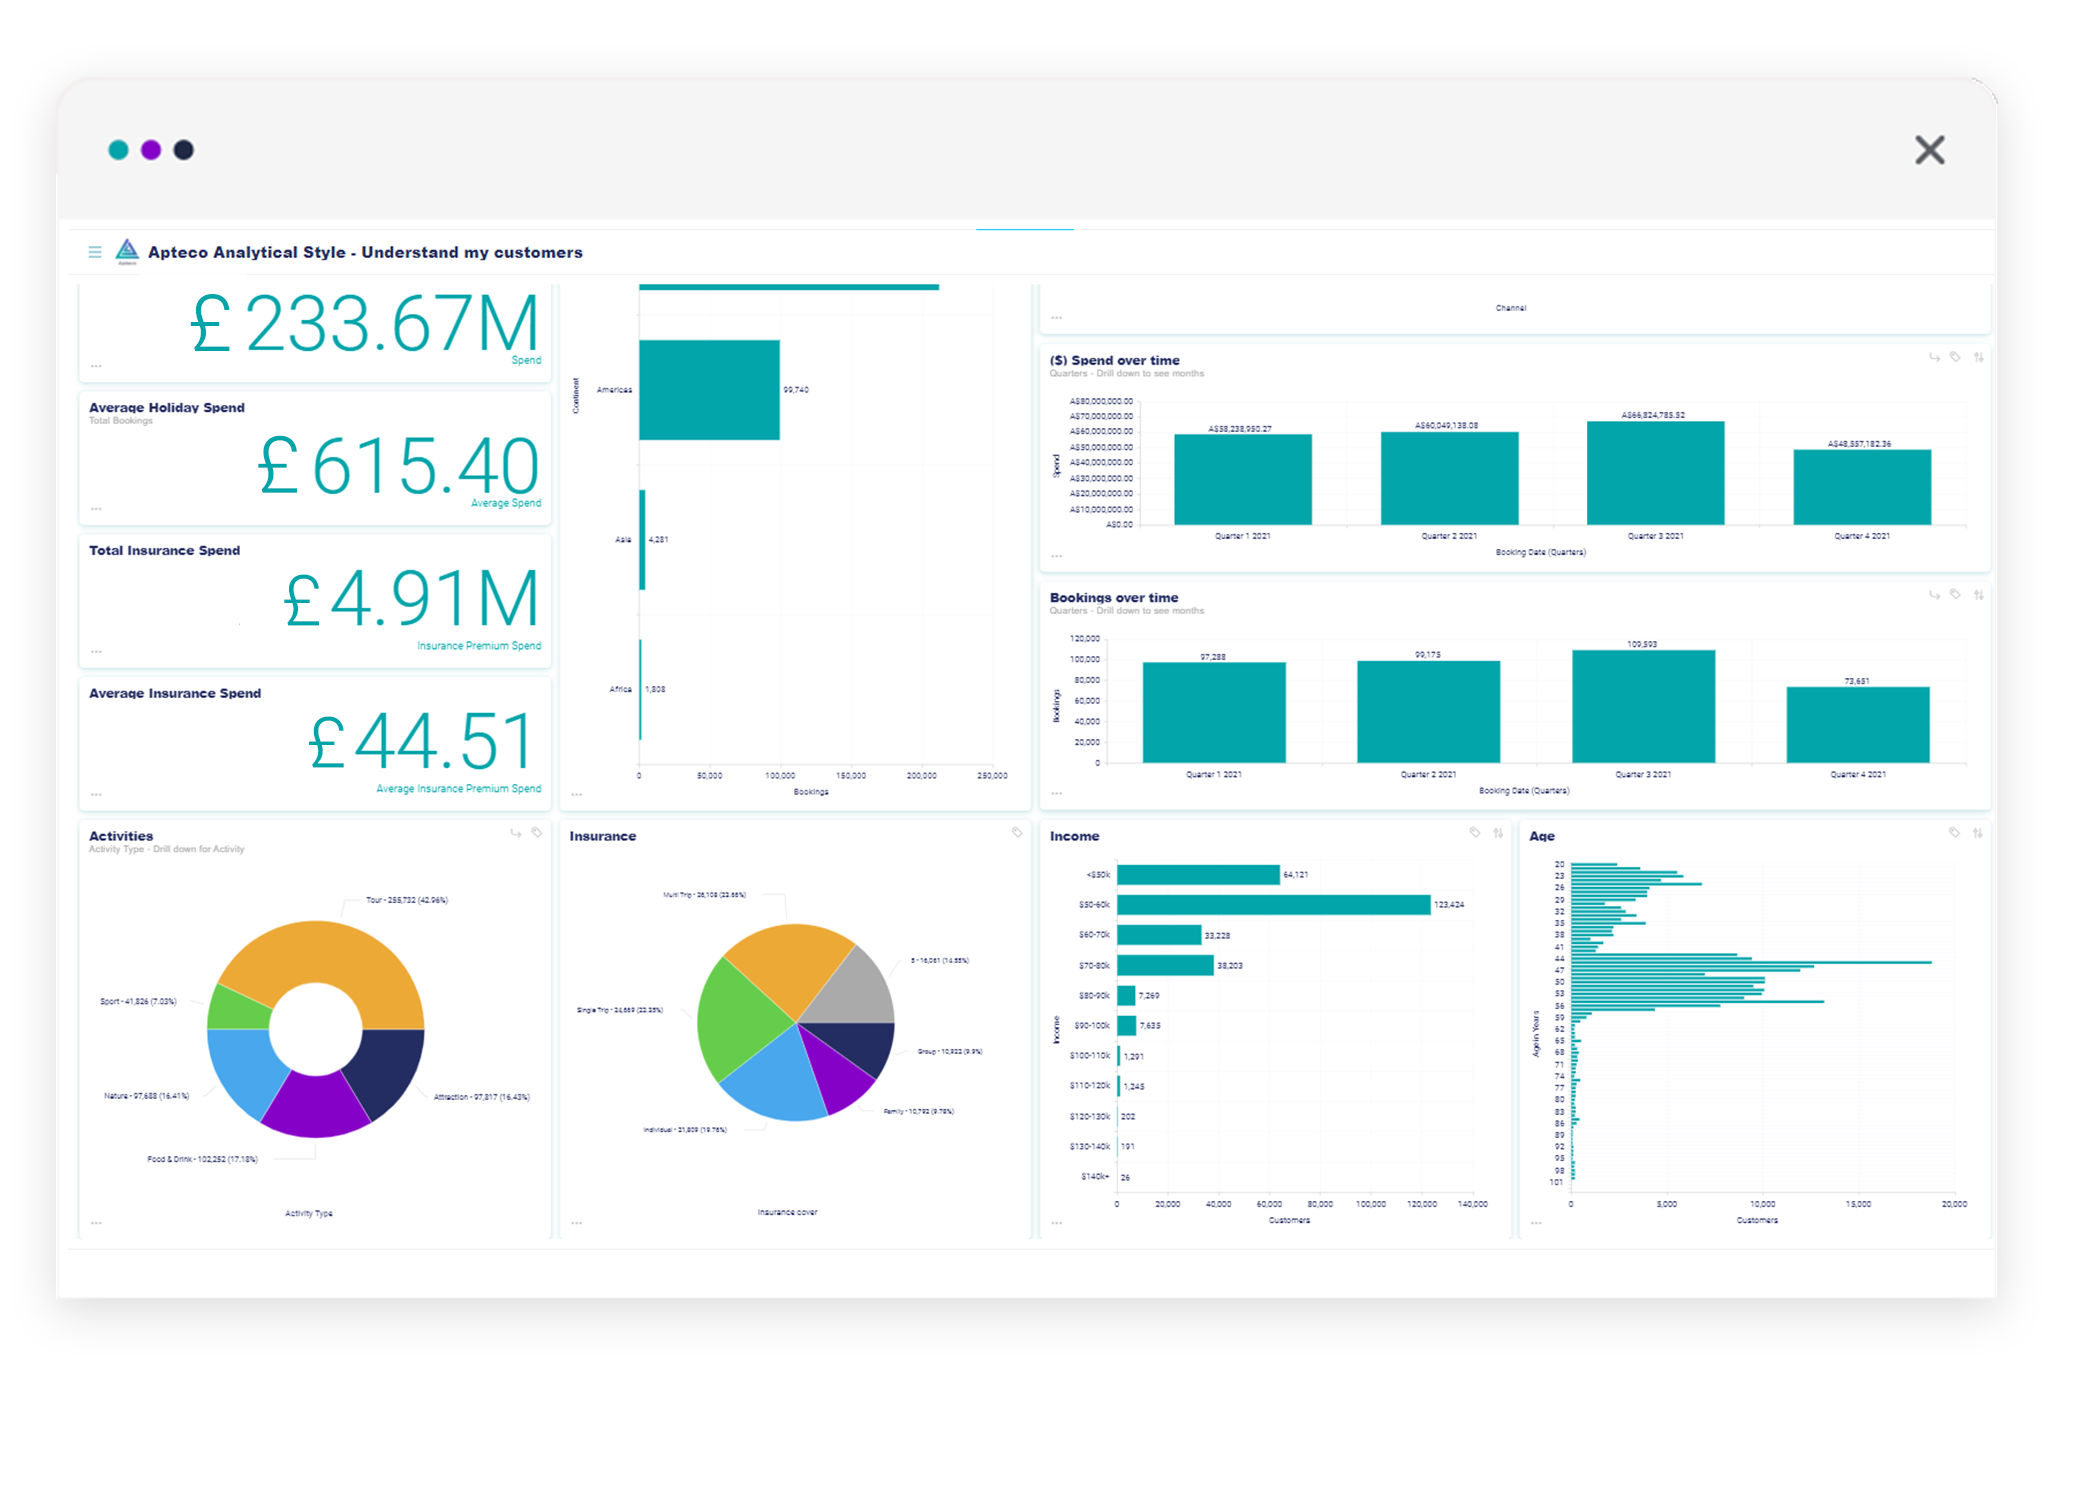
Analytical style dashboard
These dashboards provide in-depth reporting, focussing on a specific business function or topic with drill down functionality to reflect different levels of granularity, allowing users to explore areas of interest. The Analytical dashboard is frequently used to evaluate a situation and provide results of findings so the next course of action can be determined.
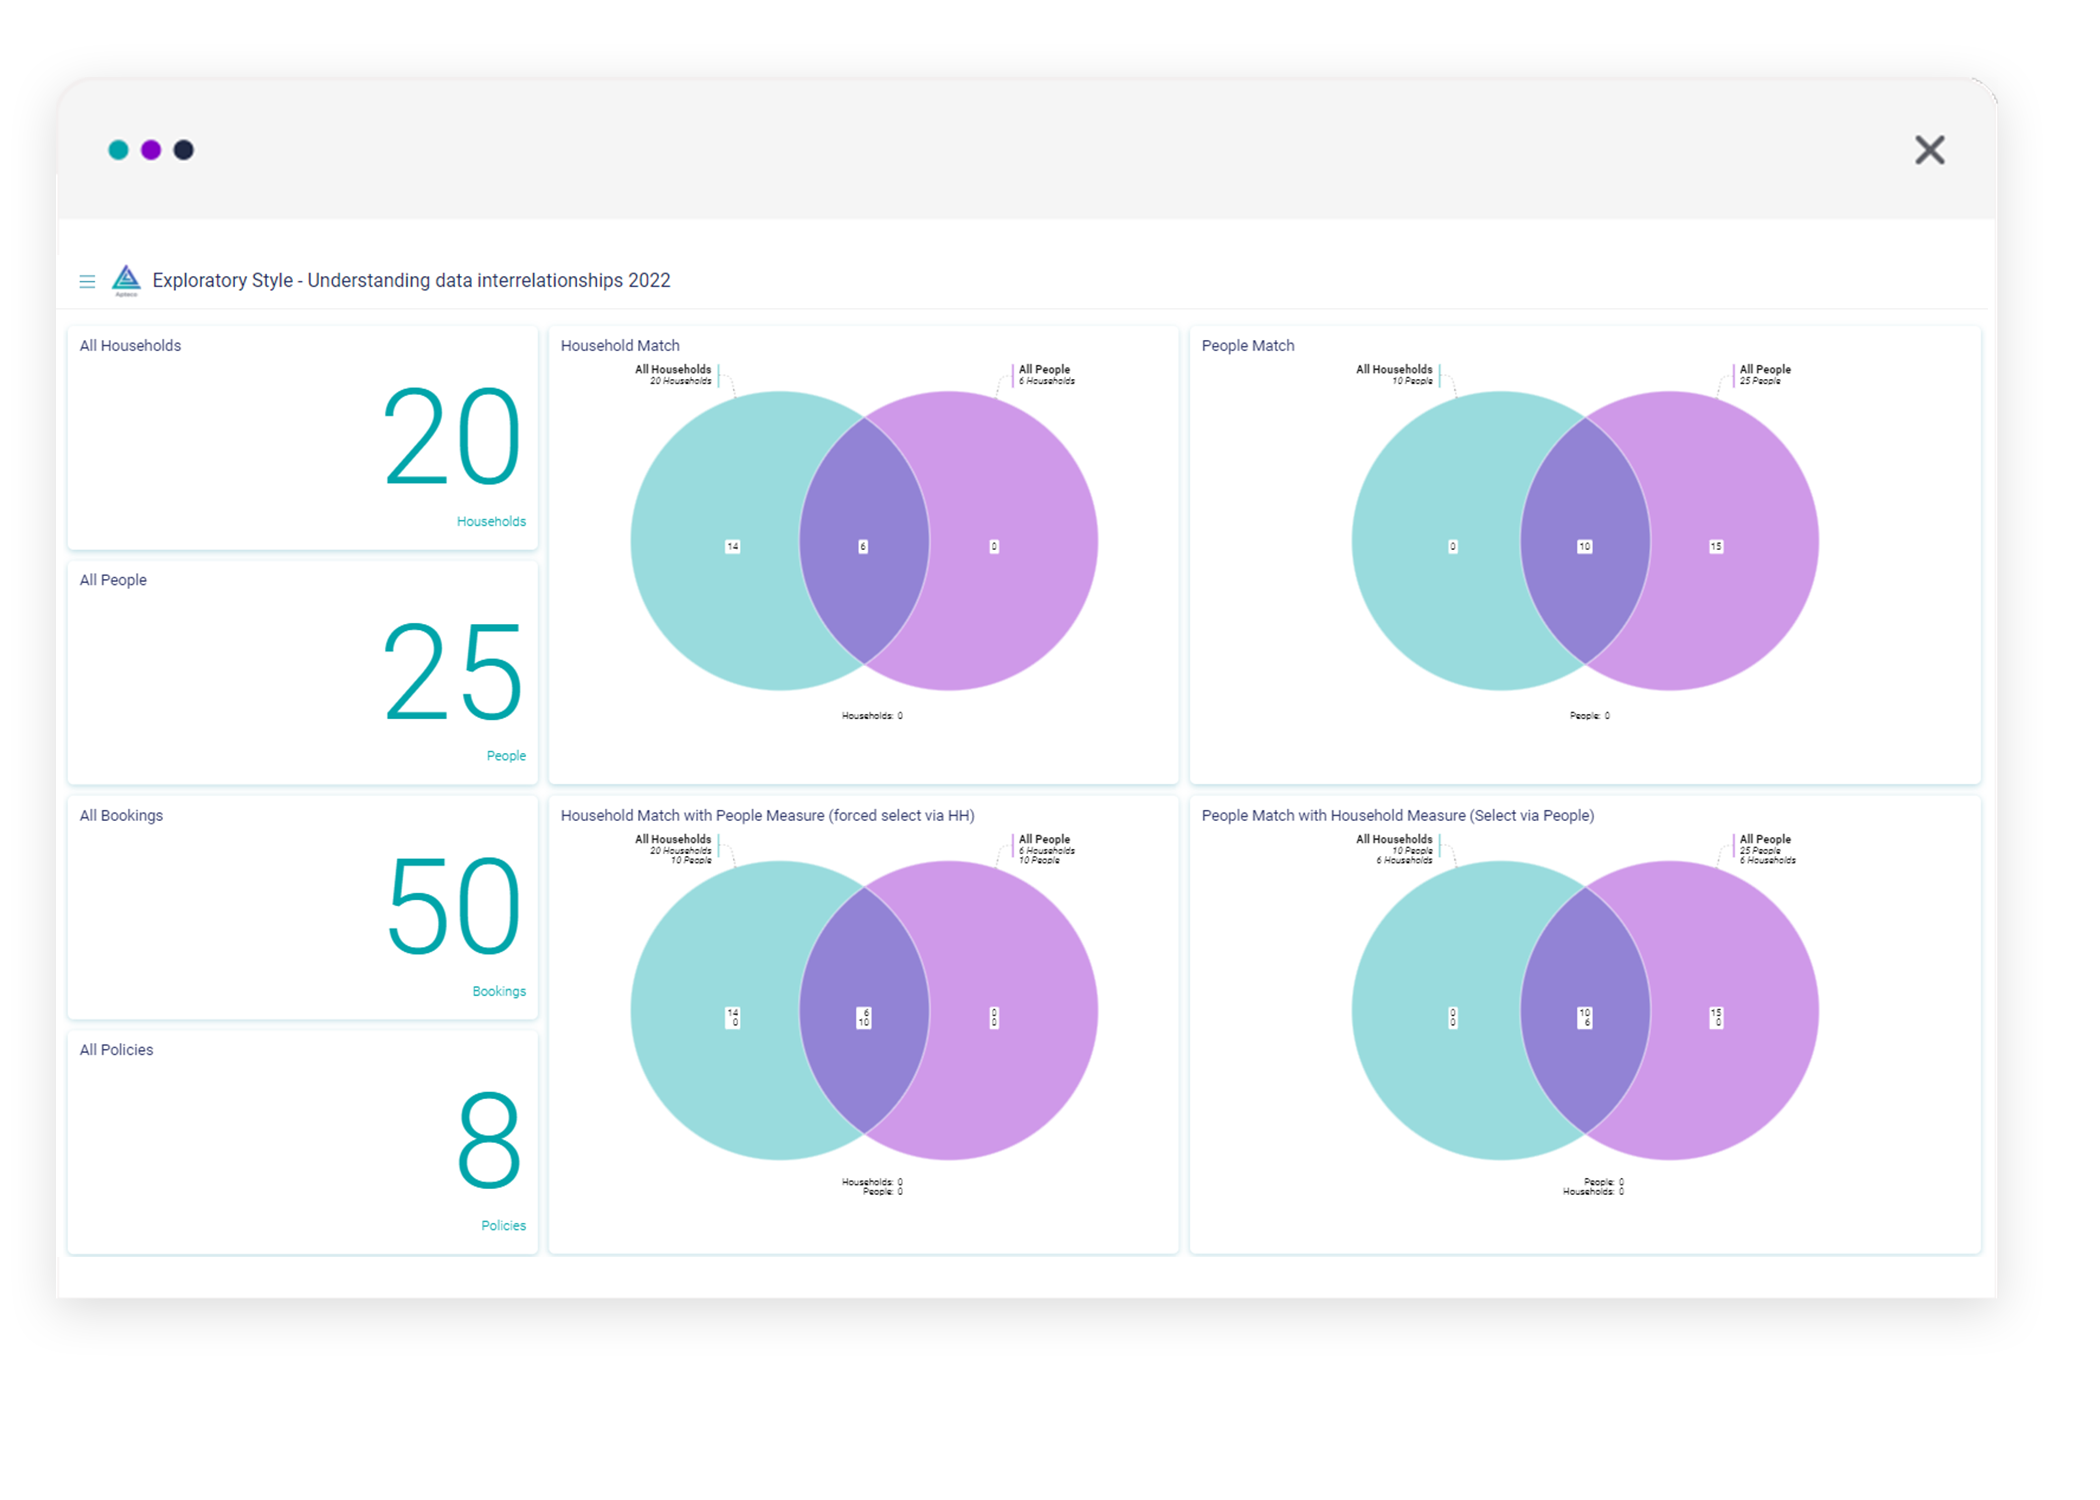
Exploratory style dashboard
These dashboards are created by advanced users on an ad hoc basis to help understand complex information. The exploration process allows advanced users to determine the best means of visualising the data so that it can be clearly portray it to other users through one of the other dashboard styles.
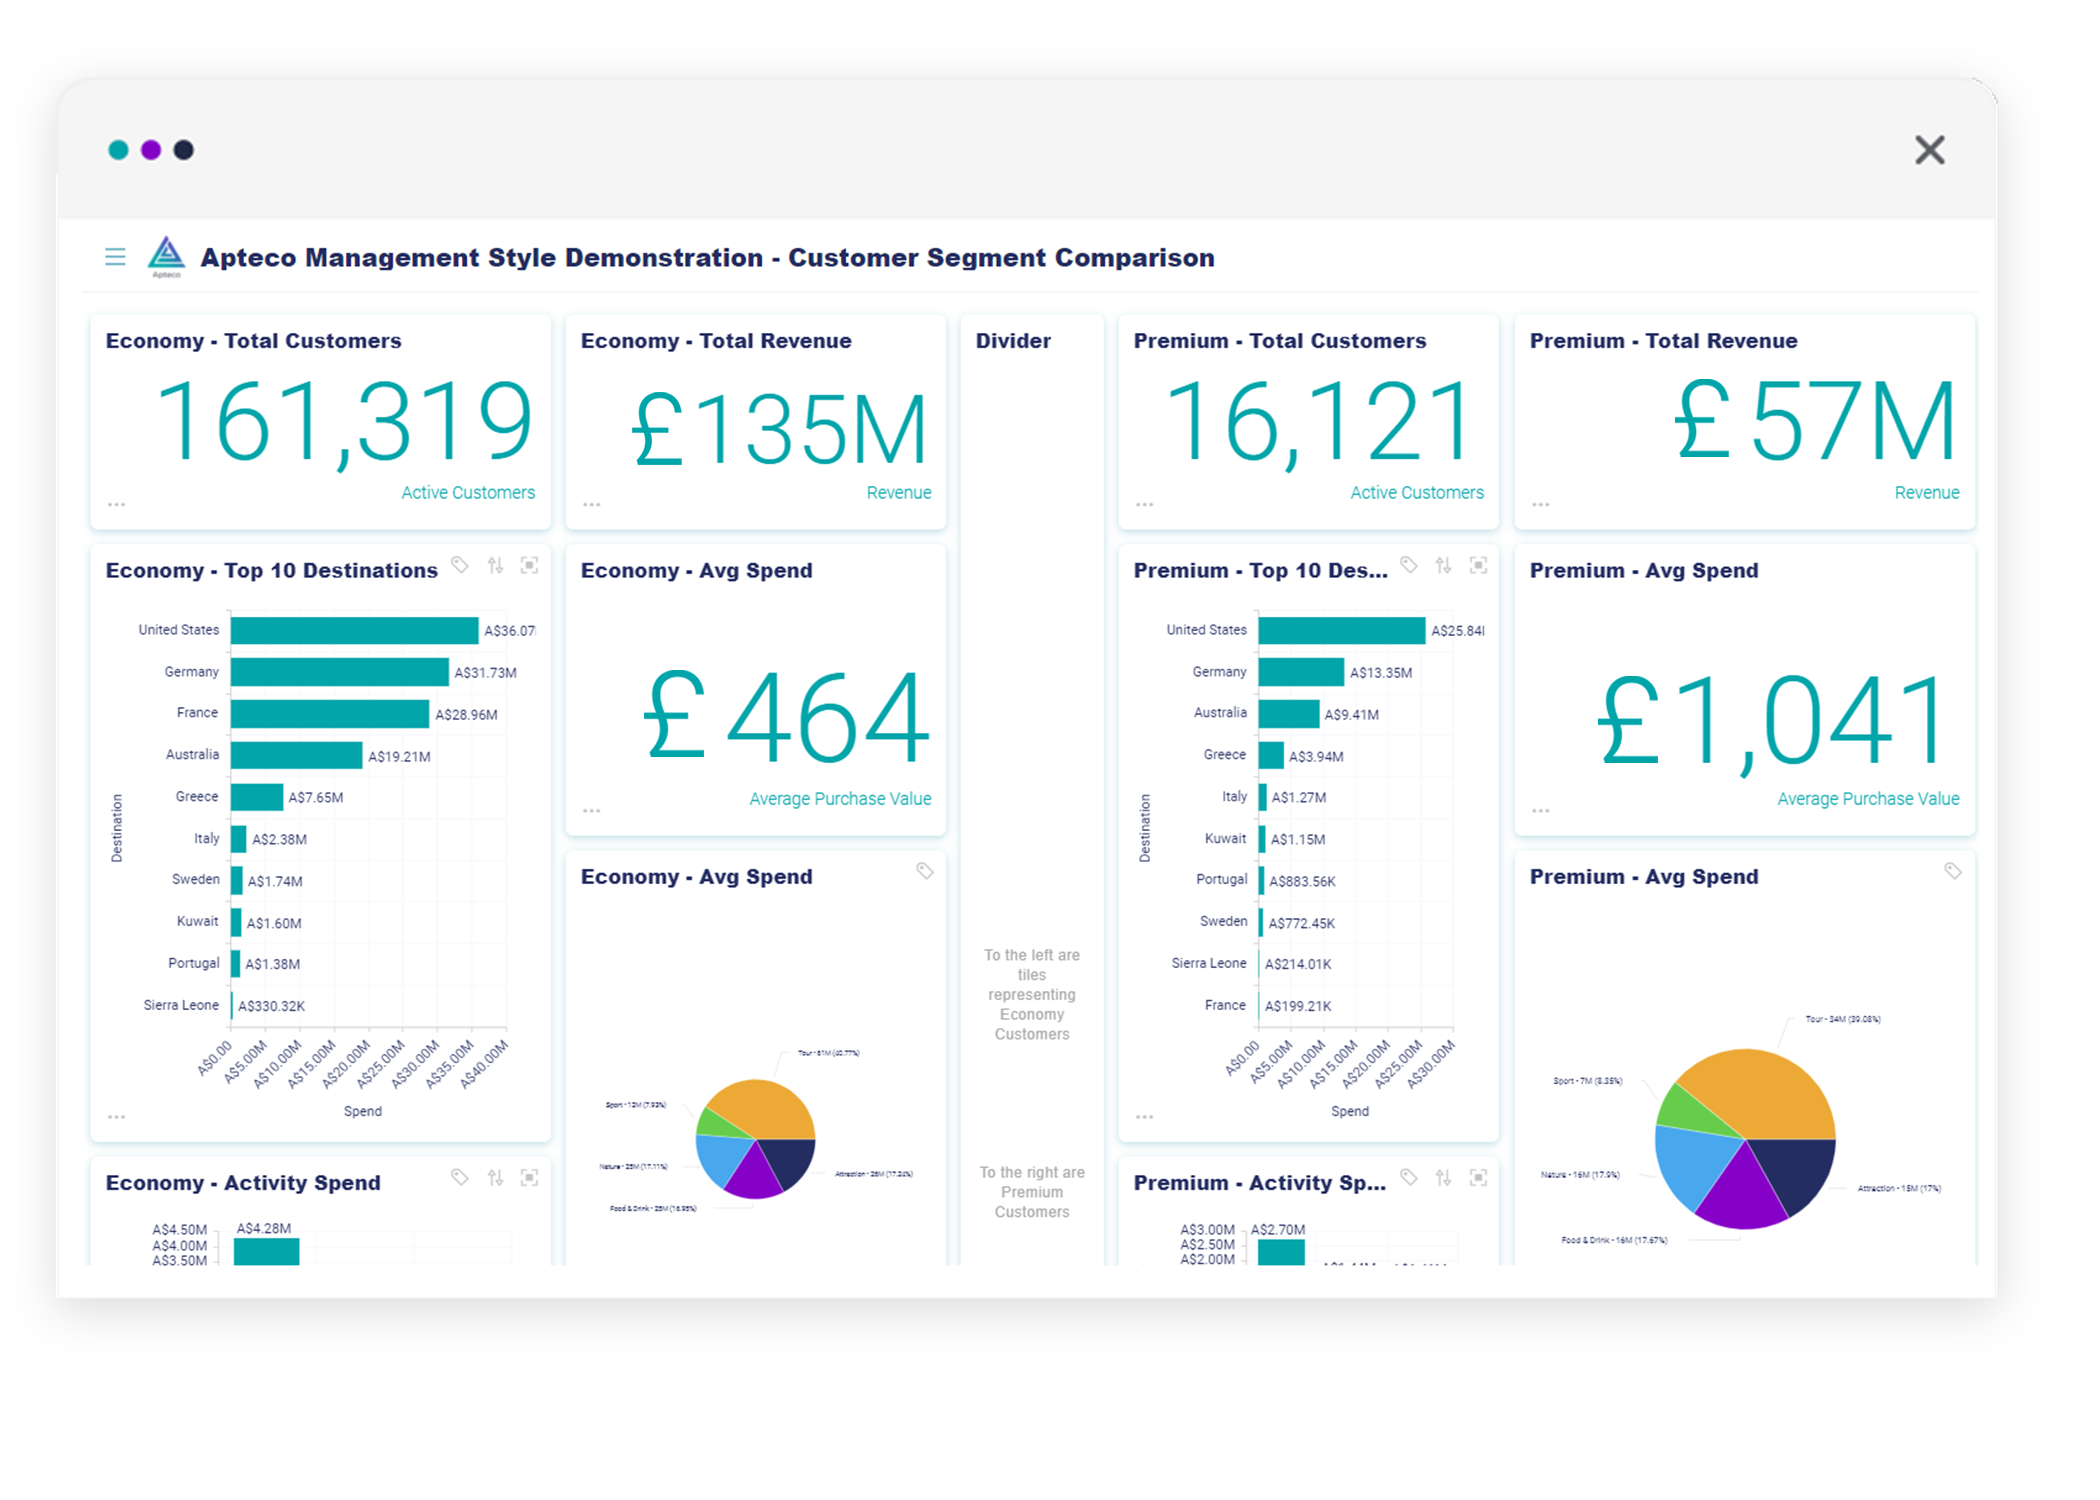
Management style dashboard
This is high level reporting, designed to inform at a glance. The management style dashboard typically reflects a situational status frequently using benchmarks to draw comparisons and is used on a regular basis to provide clarity and transparency to a broader audience.
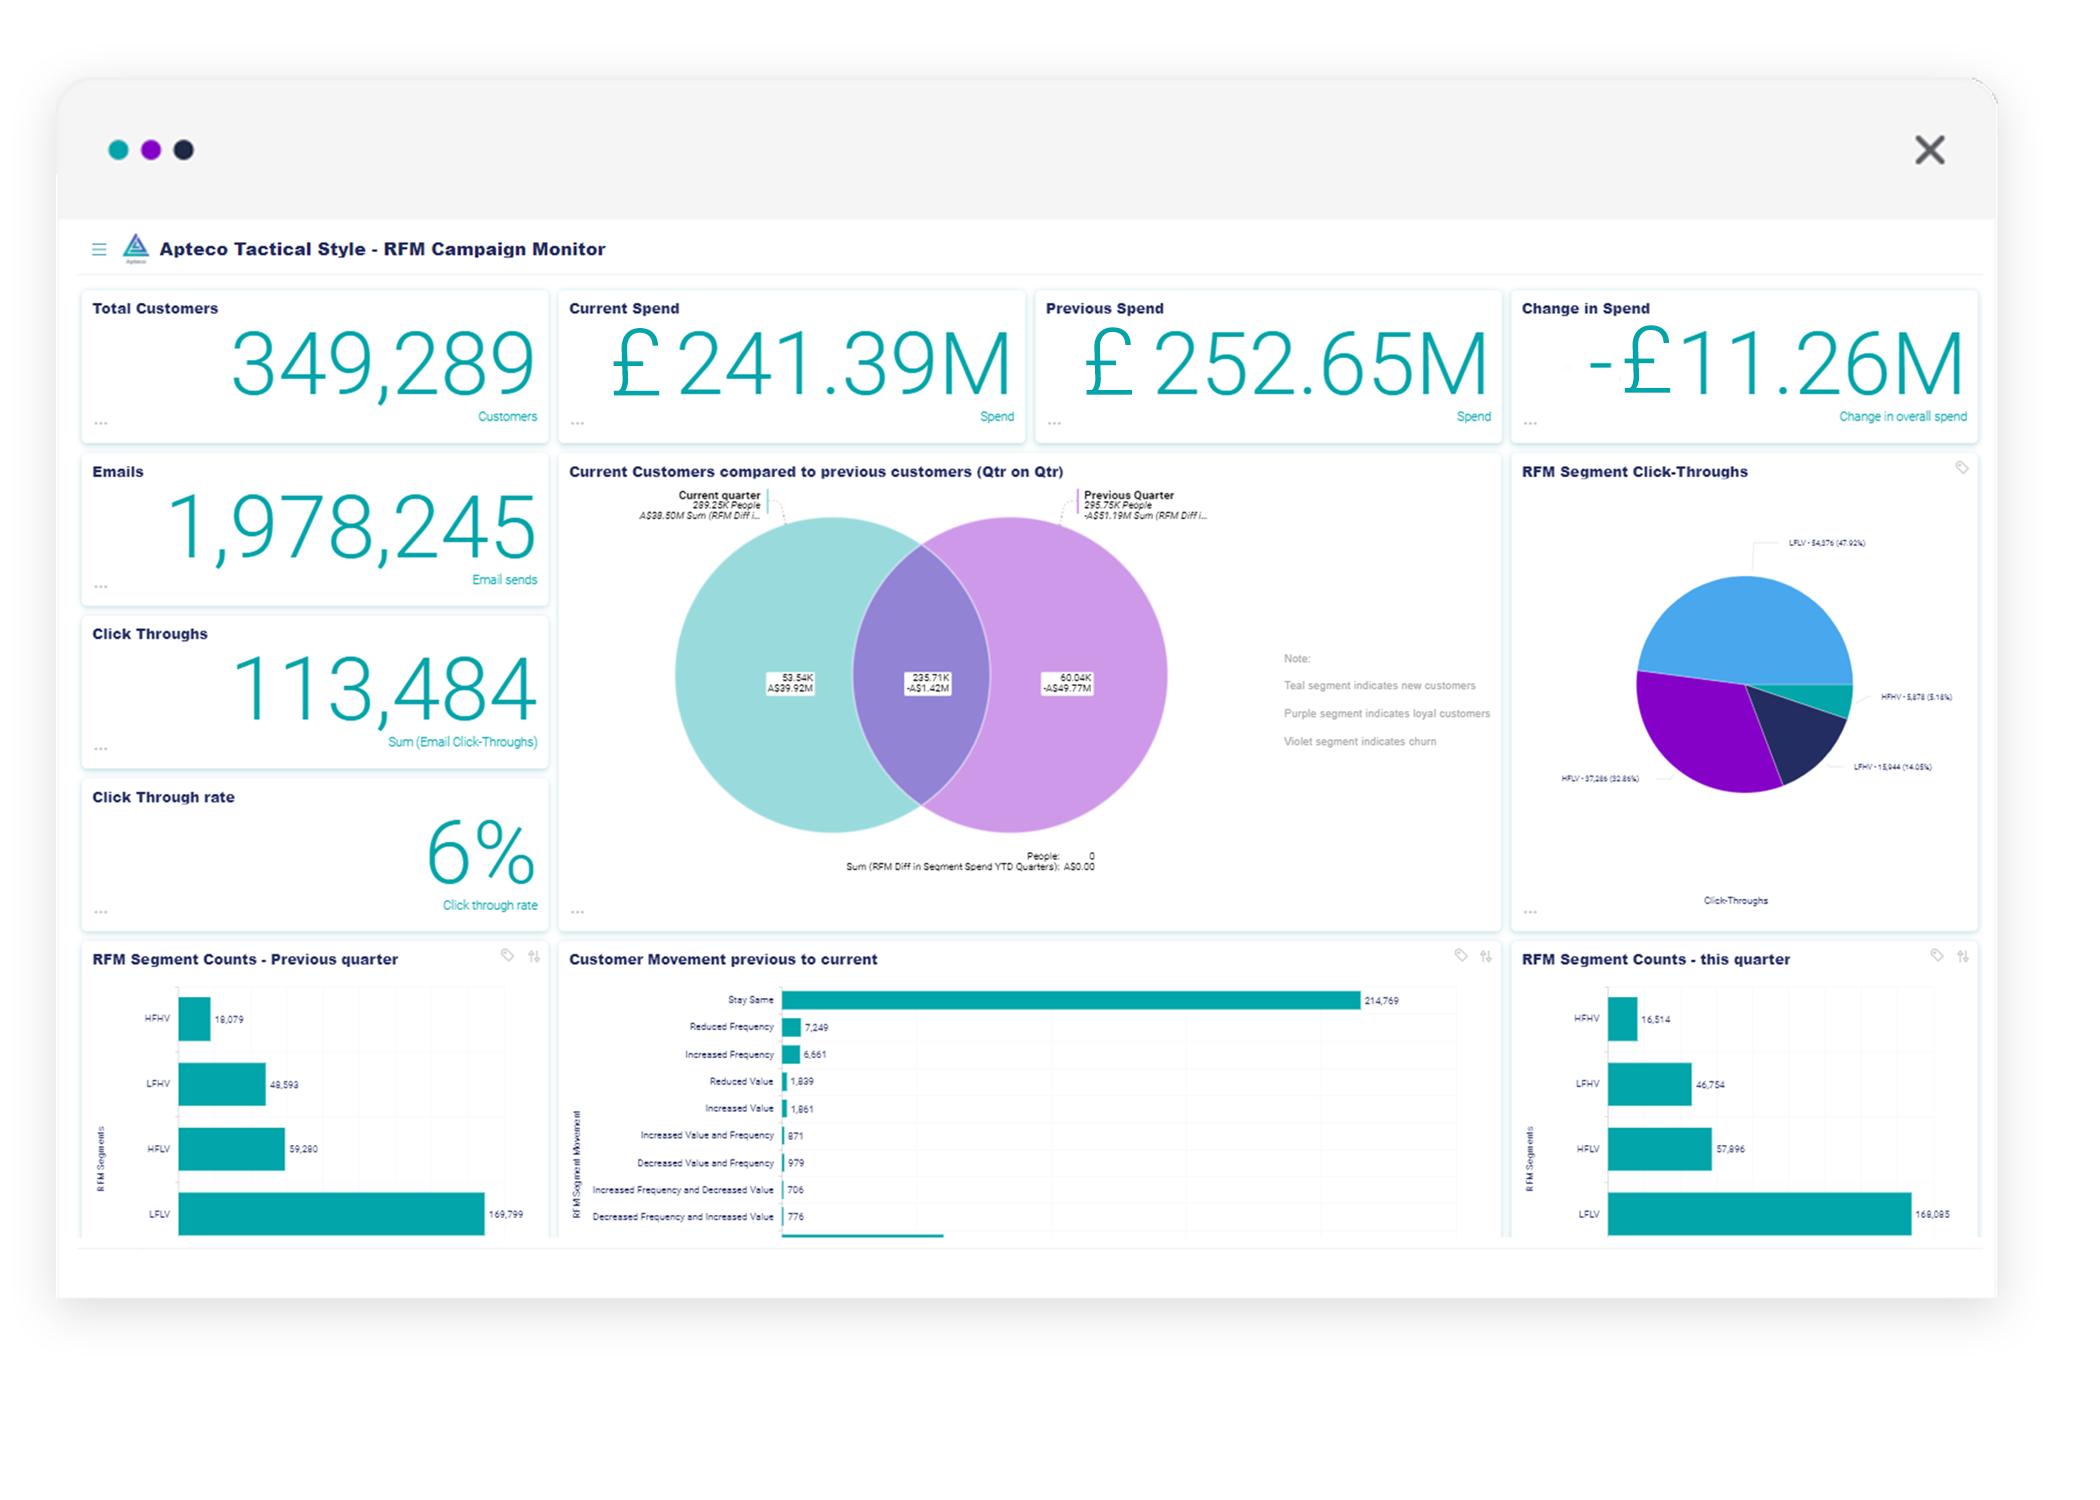
Tactical style dashboard
The tactical dashboard allows you to evaluate and react to results by focussing on a specific business scenario and reacting to observations, particularly those that are unexpected. This dashboard design permits analysis and the implementation of a mitigating strategy from the dashboard to influence performance.
:format(webp))
:format(webp))
:format(webp))