Powerful analytics
Prove value, make smarter moves, and know your customers better than ever before.

"I want fast, trustworthy and data-led actionable insights that I can use immediately to target, personalise, and optimise campaigns."
"I don’t want endless spreadsheets, overloaded dashboards and manual workarounds that delay decisions or hide what really matters."
Actionable insights for better decisions
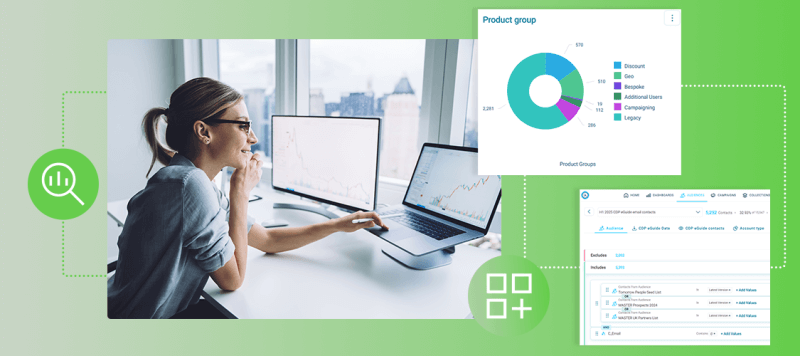
Great marketing starts with clarity, not guesswork. Our analytics software transforms complex data into insights you can act on immediately. Uncover your most valuable customers, identify high-performing regions with geo-analysis, and reveal the traits that define your audiences with profiling. Or go even deeper with predictive, behavioural and customer journey analysis. Together, these capabilities give marketers a clear view of what drives results, empowering faster decisions, sharper targeting, and smarter strategies that consistently deliver measurable growth and stronger customer relationships.

Flexible integration capabilities make it easy to access all your data sources providing a single source of truth, eliminating siloed analysis, and simplifying data access.
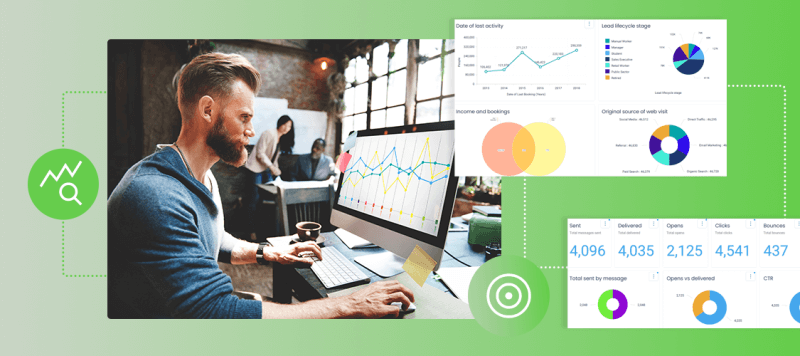
Share customer insights, revenue, and channel performance with executives and stakeholders with interactive reports and visualisations that prove marketing impact and support informed decisions.
Get answers fast with an easy-to-use, customisable platform and support to help you navigate complex analytics, making insights accessible to every team member instantly.
Go beyond hindsight, and predict what’s coming, identify key audiences, forecast trends, and uncover actionable next steps to optimise campaigns, reduce churn, and drive measurable results.
Dashboards that aren’t rigid. They can be tailored to your needs and grow with your business, delivering the same impact for startups and scaling seamlessly to enterprise-level operations.
Delve deeper into your data with simple filter and drill down features, allowing train of thought analysis that allows you to uncover learnings, discover new customers, and unlock opportunities.
Ready to drive business growth and execute smart, automated campaigns that deliver?
Apteco empowers marketers by giving them control over their data and campaigns. Our end-to-end capability makes it easy for you to manage your marketing from start to finish.

Activate insights to drive engagement
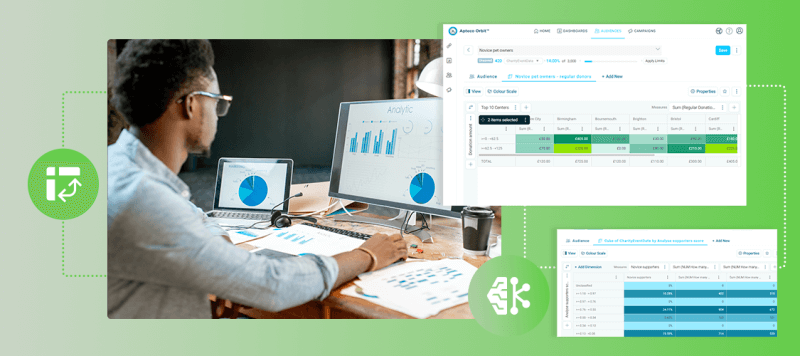
Insights are only powerful if they can be put into action. Apteco’s Orbit platform lets you create and activate audiences directly from dashboards without manual exports, while multi-tab dashboards and themes help to keep reporting consistent across teams. Filters and drilldowns allow stakeholders to explore data confidently and with 30+ chart types - from Pareto and Venn to data grids, bar charts and text tiles - you can always present your insights in the most appropriate format, turning analysis into immediate results that drive higher engagement and ROI.

Prove the impact of your marketing efforts
Understanding campaign performance is essential to marketing success. Apteco provides detailed analytics that track interactions, channels, and conversions, letting you see which campaigns drive results. Visualisations and dashboards make it simple to compare performance, uncover trends, and pinpoint opportunities for improvement. By connecting insights to outcomes, marketers can accurately calculate ROI, prove impact to stakeholders, and optimise budget allocation. With fast, reliable data at your fingertips, teams make smarter, evidence-based decisions that maximise engagement, conversions, and long-term growth.

"Apteco is truly the tool that has unified our data and marketing. We’d be lost without it and use it every single day to make data-driven decisions and put them into action in real time."
Natalie Fordham, CRM Manager, Goodwood

Flexible pricing bundles
Choose the level of analytics power you need - from audience selections and dashboards to advanced capabilities like profiling, cubes, expressions, and predictive modelling.
Selector bundle
Our most basic bundle makes audience selections easy and allows users to create, refine and share target lists.
- Hosted in the Apteco Cloud
- Audience selections
- Sharing & exporting
- One starter dashboard
Analyser bundle
Powerful visualisation tools to help understand your customers and their behaviour. Includes all Selector bundle features, plus:
- Advanced selections & profiling
- Unlimited dashboards
- Email & SMS upload & response gathering
- CRM integrations
Predictor bundle
Uncover deep insights into the customer journey and discover new marketing opportunities. Includes all Selector and Analyser bundle features, plus:
- Predictive & behavioural modelling
- PWE models and lookalikes
- Best next offer & cluster analysis
- Advanced segmentation
We play nicely with others
By integrating Apteco software with your existing applications and tools, you can get one version of the truth and operate with greater accuracy and efficiency.
Emails your audience loves, powered by data you trust.
Design, personalise and automate beautiful, impactful emails with Apteco’s intuitive drag-and-drop email builder.

Uncover key insights
Explore our practical eguides, infographics, blogs, videos, webinars, and more to build on your analytics skills.